This is the fourth post in a series of productivity tips and tricks to help you debug web applications with Firefox Devtools. It shows you 5 tips & tricks for working with the Network Monitor in the Firefox Developer Tools.
I use the Network Monitor tool when I’m doing performance debugging and optimizations on a website, so most of the tricks in this post focus on that. It’s the very first tool I use when performance debugging, because no matter how fast your JavaScript is running, it still breaks performance if it’s 20 MB of it.
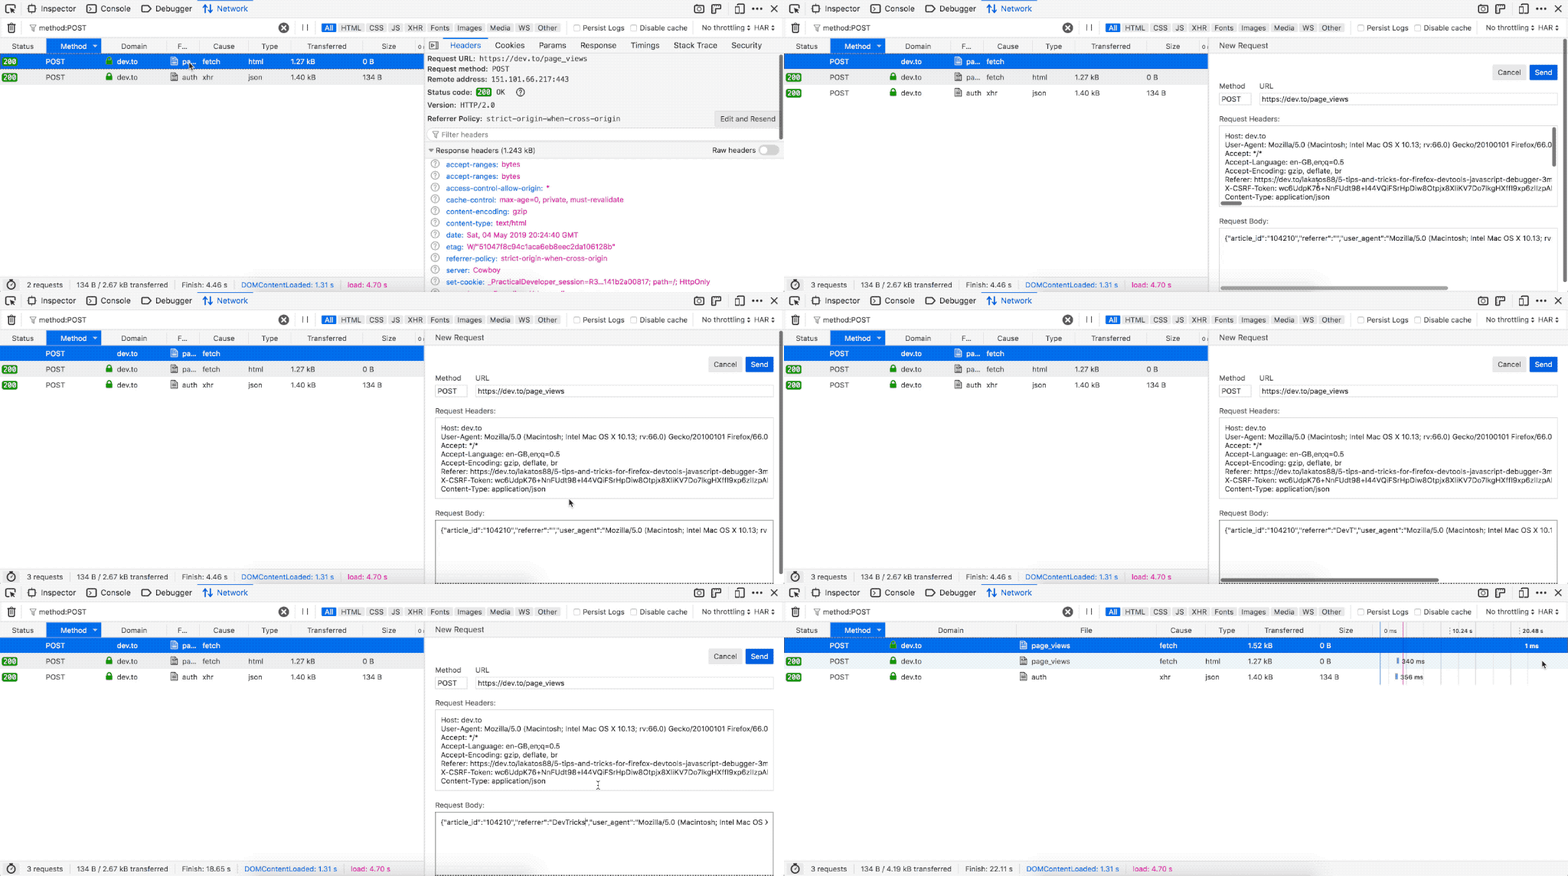
Edit and Resend HTTP Requests
You can edit and resent HTTP requests in the Network Monitor. Sometimes I use it to debug POST requests that go to my server or the GET requests that get the data for the website, I rarely use this trick to re-send HTTP requests that just fetch HTML, CSS and JavaScript files or images. It’s really handy to use especially when you’re sending data to the server at the end of a complicated flow, and you’ve got a bug in your request. It allows you to quickly test a possible fix without having to do all the work and re-testing of the flow.
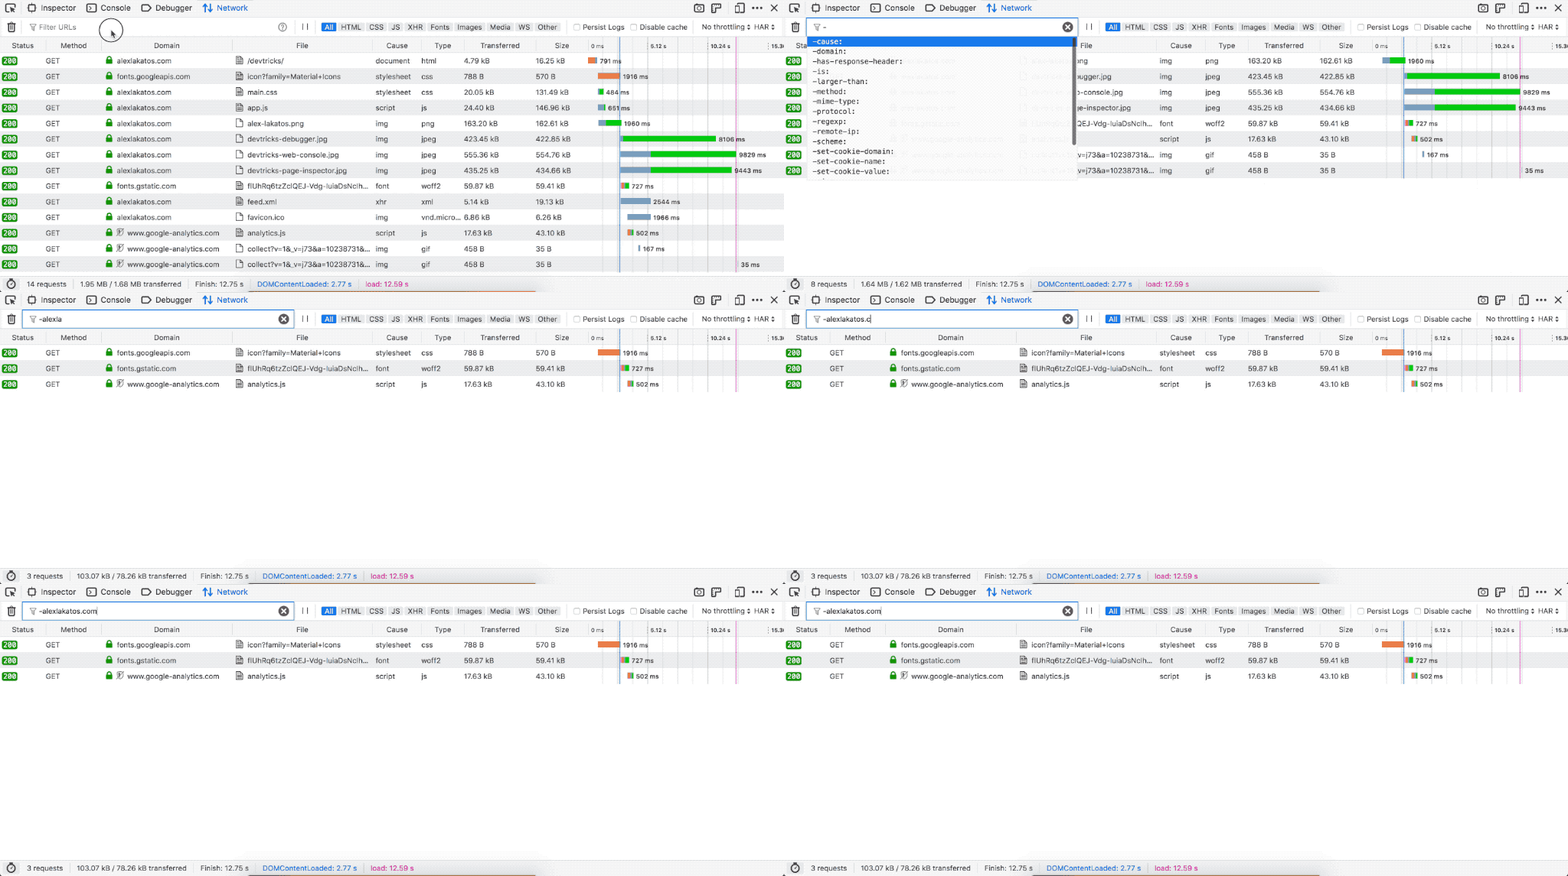
Filter Requests that don’t contain your query string
You can filter HTTP requests by domain in the Network Monitor by pressing CMD + F on a Mac (CTRL + F on Windows and Linux). If you want to search for all the requests that don’t contain a string in the domain URL, you can start your query with a dash (-), and that filter only the domains not matching the query string. It’s really useful to find all the external requests during a performance audit, so you can later move those resources to the same domain.
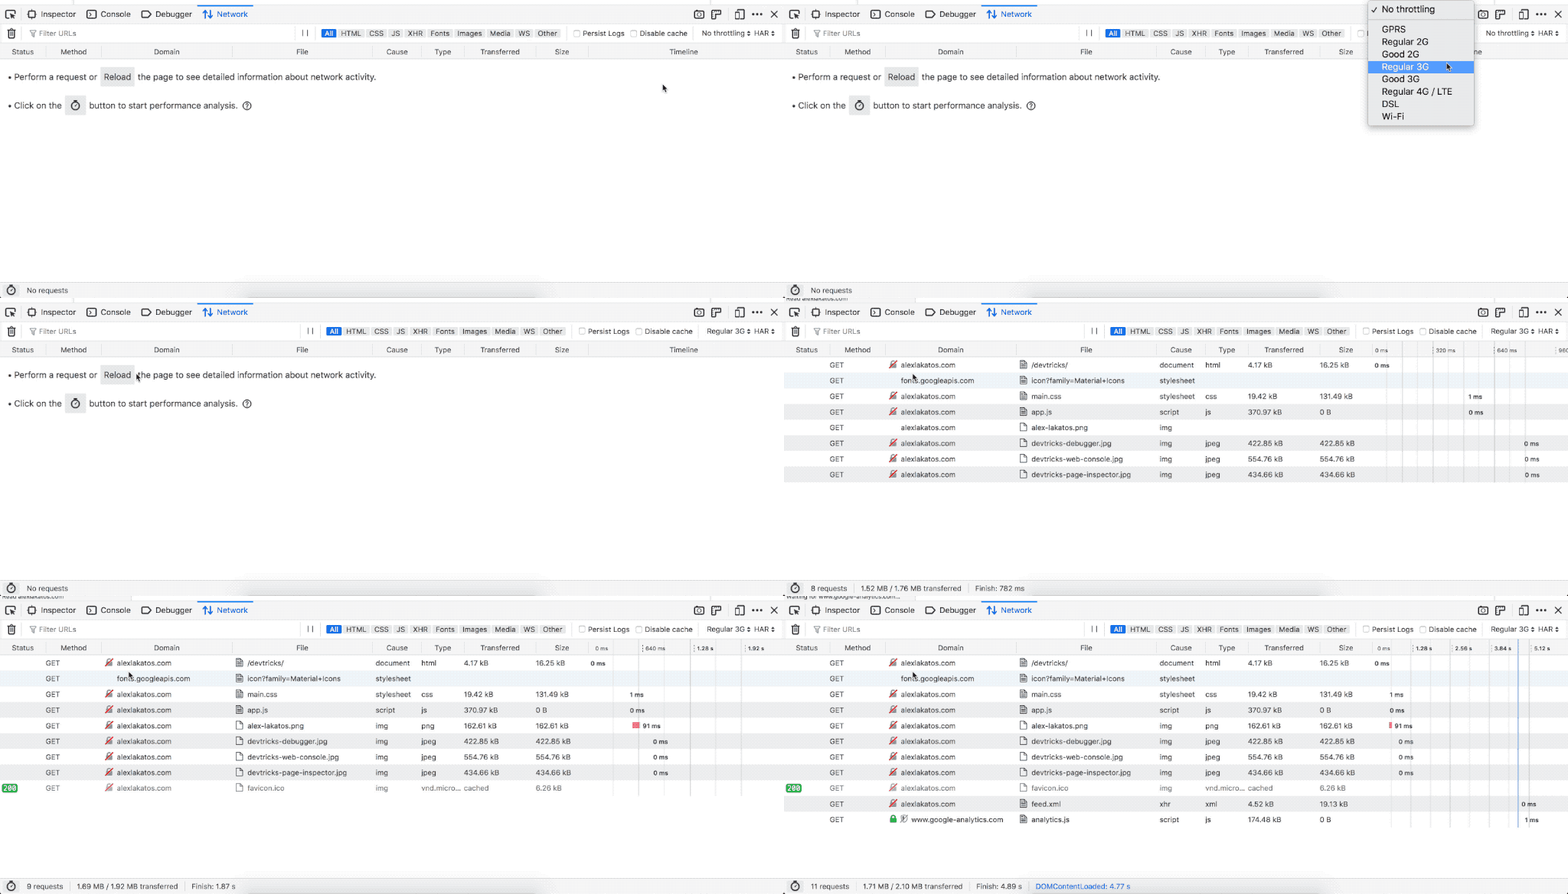
Speed Throttling
You can throttle the speed of your network requests and see how your website loads on different connections. Firefox has a lot of presets useful for mobile devices, with an intuitive name instead of me having to guess what speed a bad 3G connection would be.
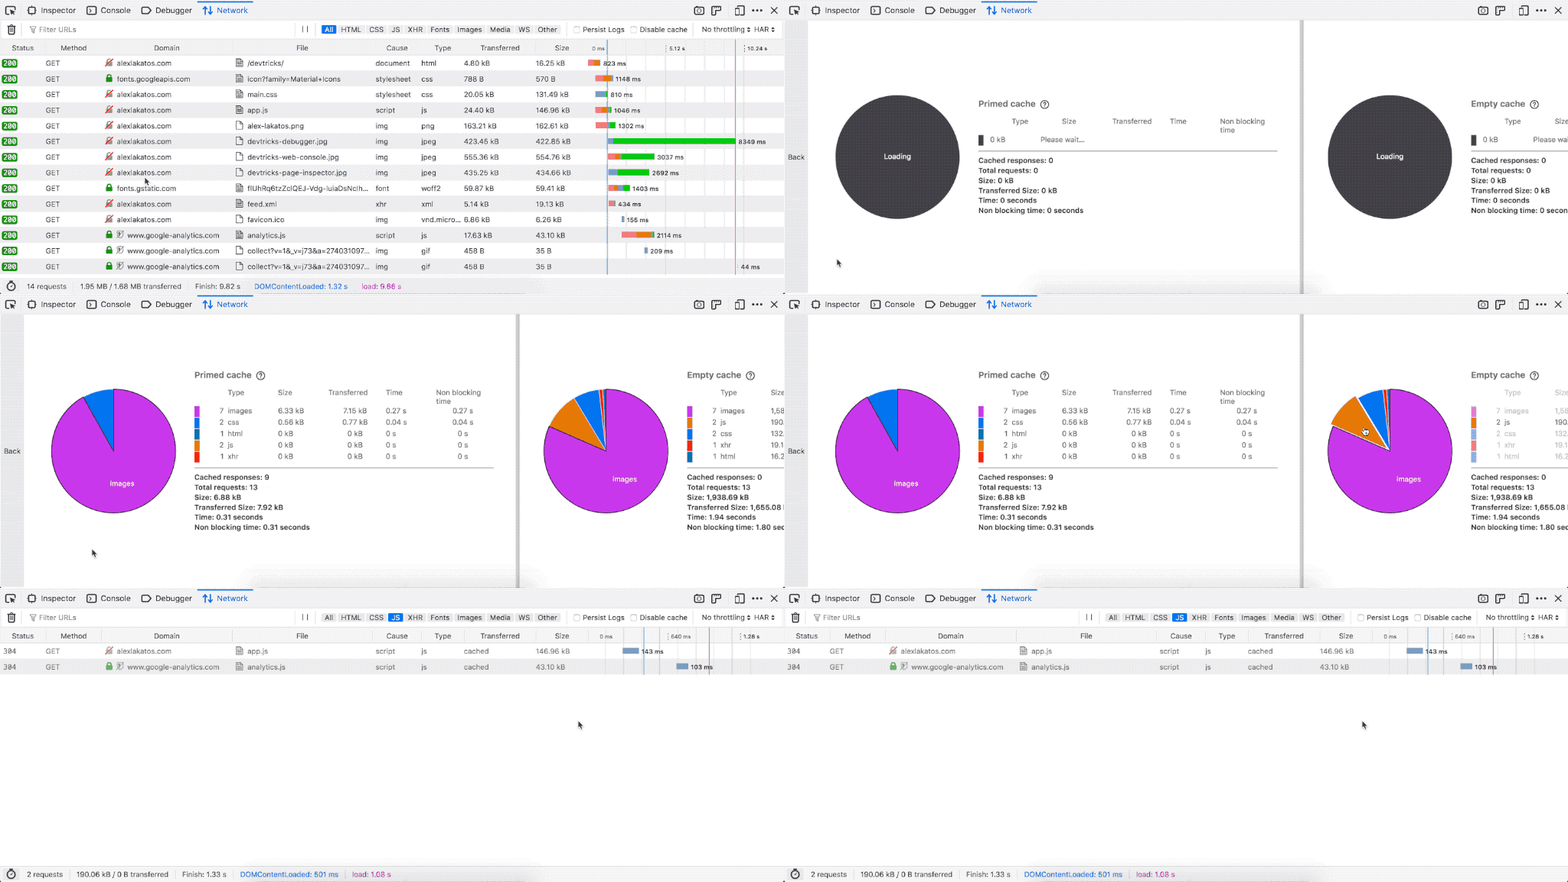
Hot/Cold Profiling
You can run visual performance analysis on the HTTP requests your website is making. If you’ve just opened the Network Monitor, there is a stopwatch icon on the main panel, otherwise, you can find it in the lower left corner of the Network Monitor. Once you’ve clicked the icon, the Network Monitor loads the website twice: once with an empty browser cache or “cold”, and once with a primed browser cache or “hot”. It’s really useful to simulate the first time a user loads your site and any following visits.
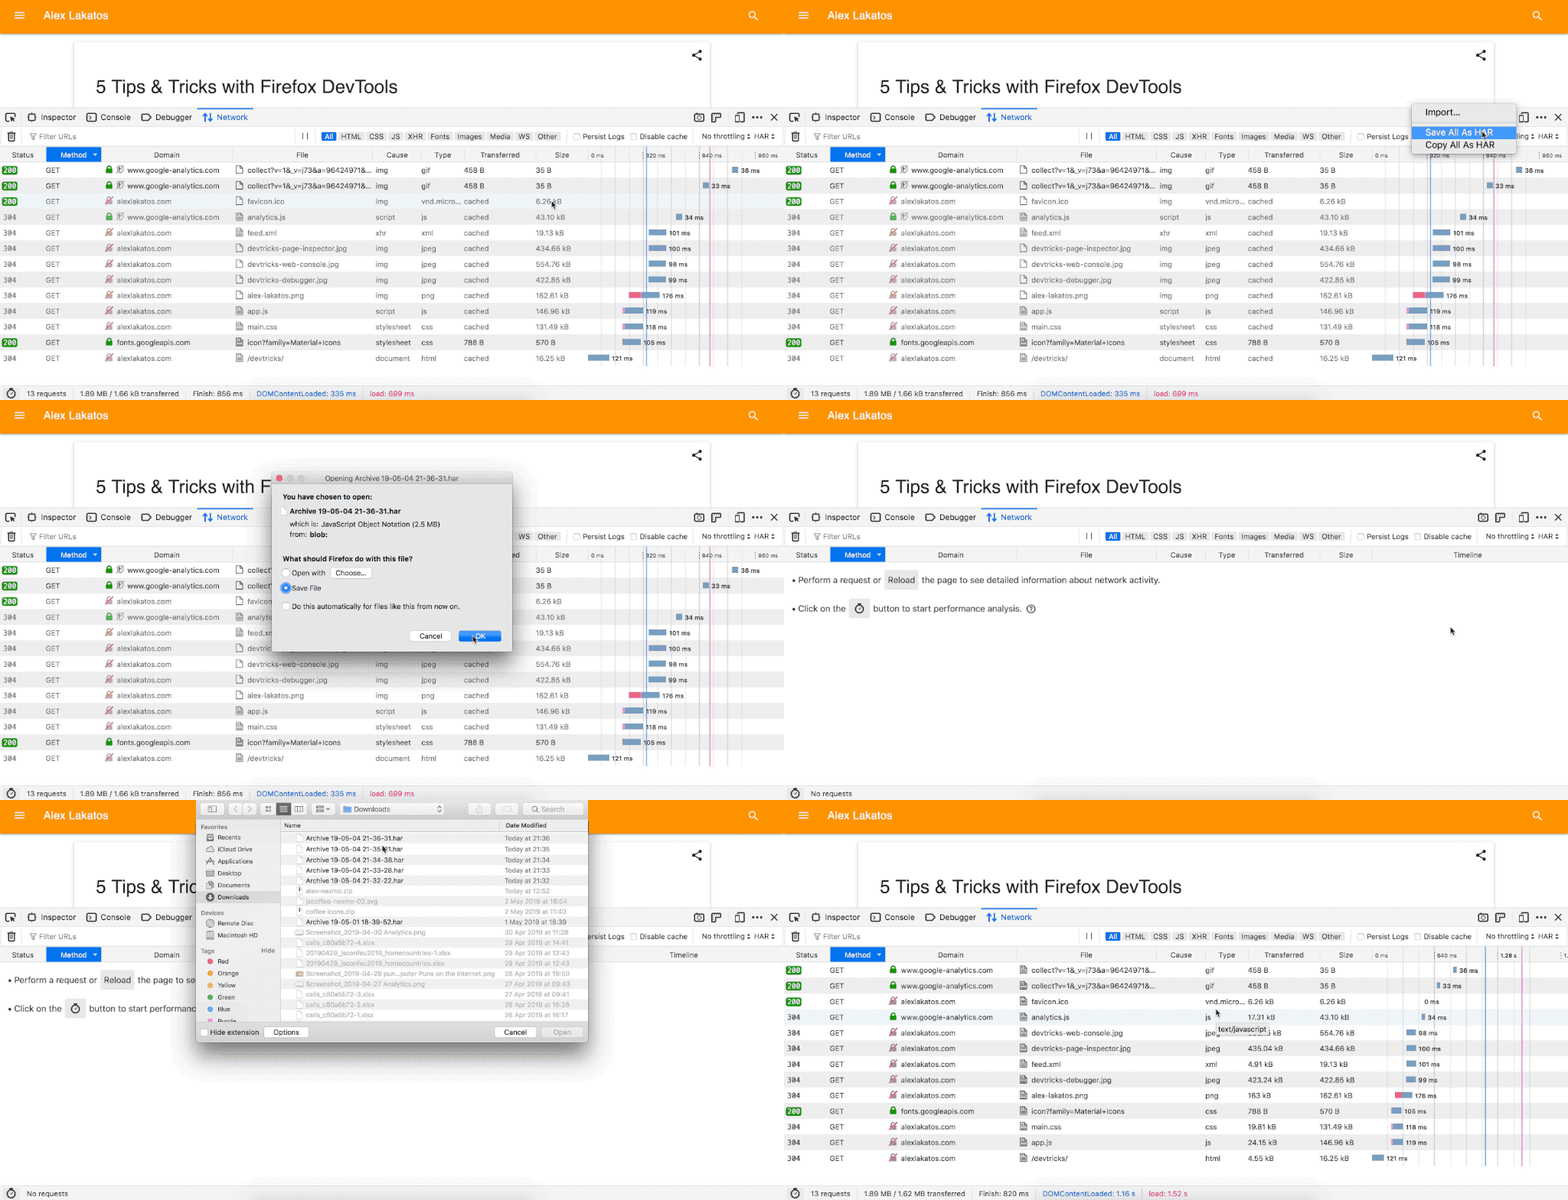
Save/Import HAR
You can save a snapshot of the network requests in your Network Monitor. It saves them as HAR or HTTP Archive format. You can also import HAR files and have them display in the Network Monitor so you can debug them. This one is especially useful when working with distributed teams, different parts of the world will give you a different timeline. This way you can all work off of the same baseline, or debug that pesky 10-second delay in your images that only happens behind some obscure firewall with your backup CDN. You get the point.
It’s a weekly thing
This is a weekly thing, I’ve gathered so many tricks over the years. If you’ve liked this or want to see more, I’m @avolakatos on Twitter, follow me there, that’s where the magic happens.


