This is the second post in a series of productivity tips and tricks to help you debug web applications with Firefox Devtools. It shows you 5 tips & tricks for working with the Web Console and the Console API in the Firefox Developer Tools.
CSS Styling in the Web Console output
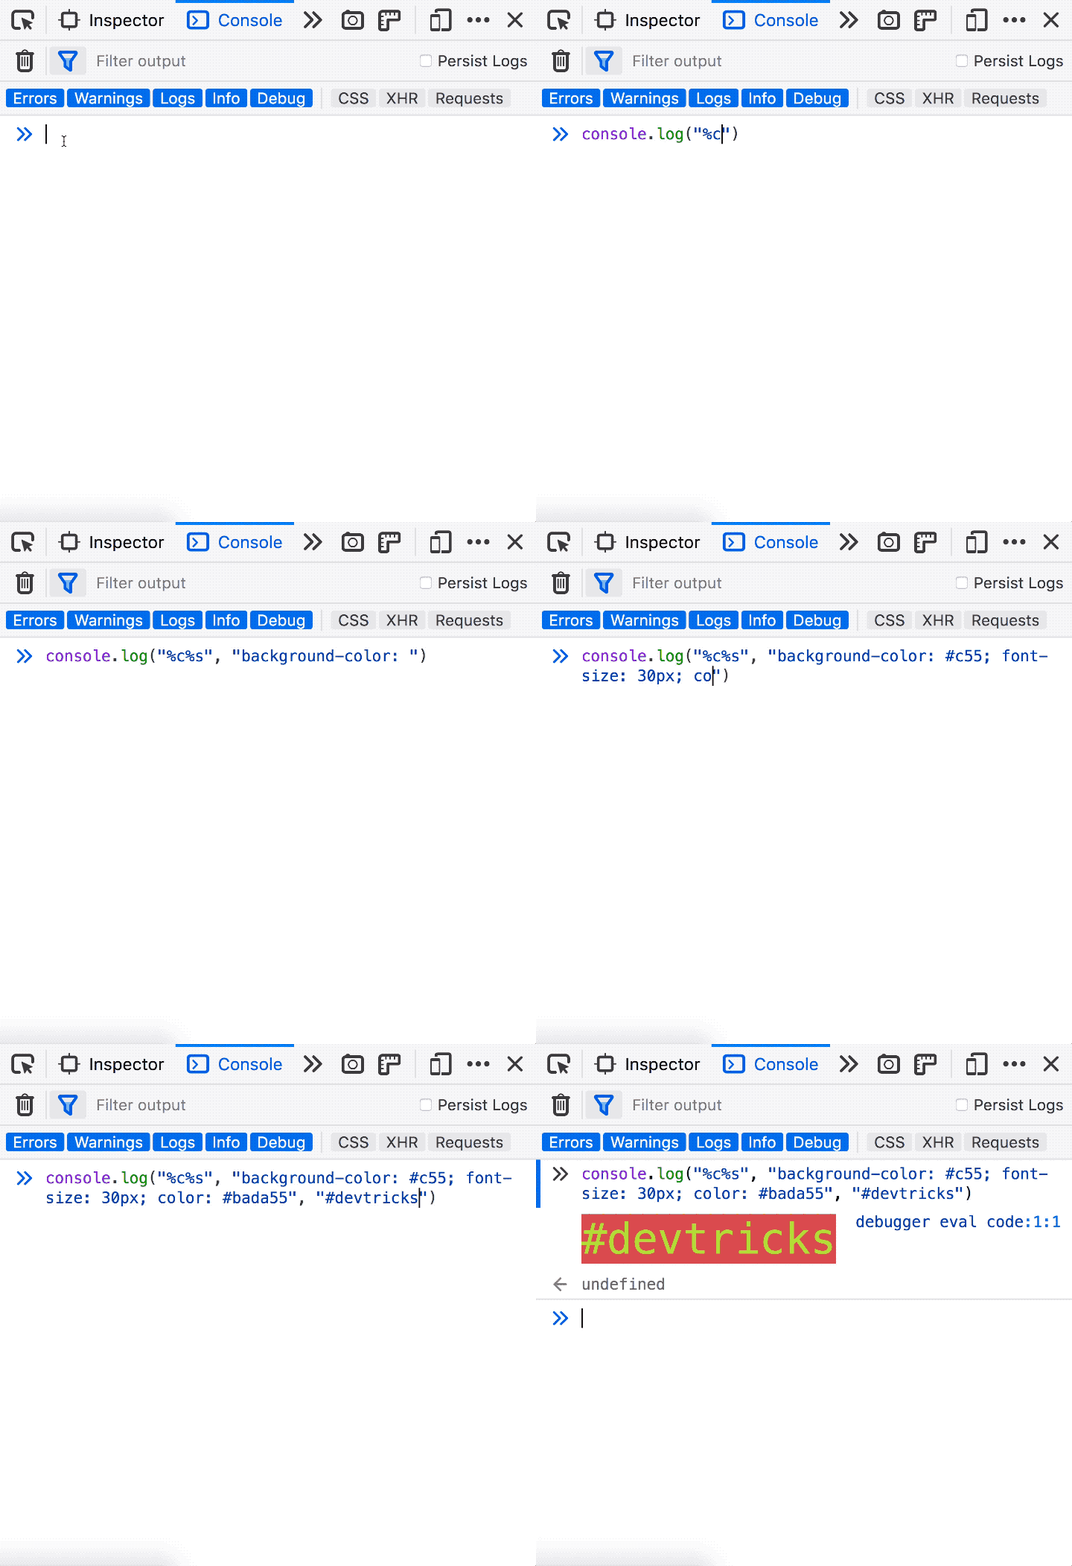
console.log("#%c%s%c%s", "color: #bada55", "dev", "color: #c55", "tricks")
You can style your Firefox Developer Tools Web Console output using CSS. Not all properties are supported, but quite a few are. The %c directive indicates that whatever comes after it will be styled, while the %s is string substitution. It’s really handy for:
- highlighting the important parts of a log.
- multiple color coded level of logging, when
console.info,console.warnandconsole.logare not enough.

Search Web Console History
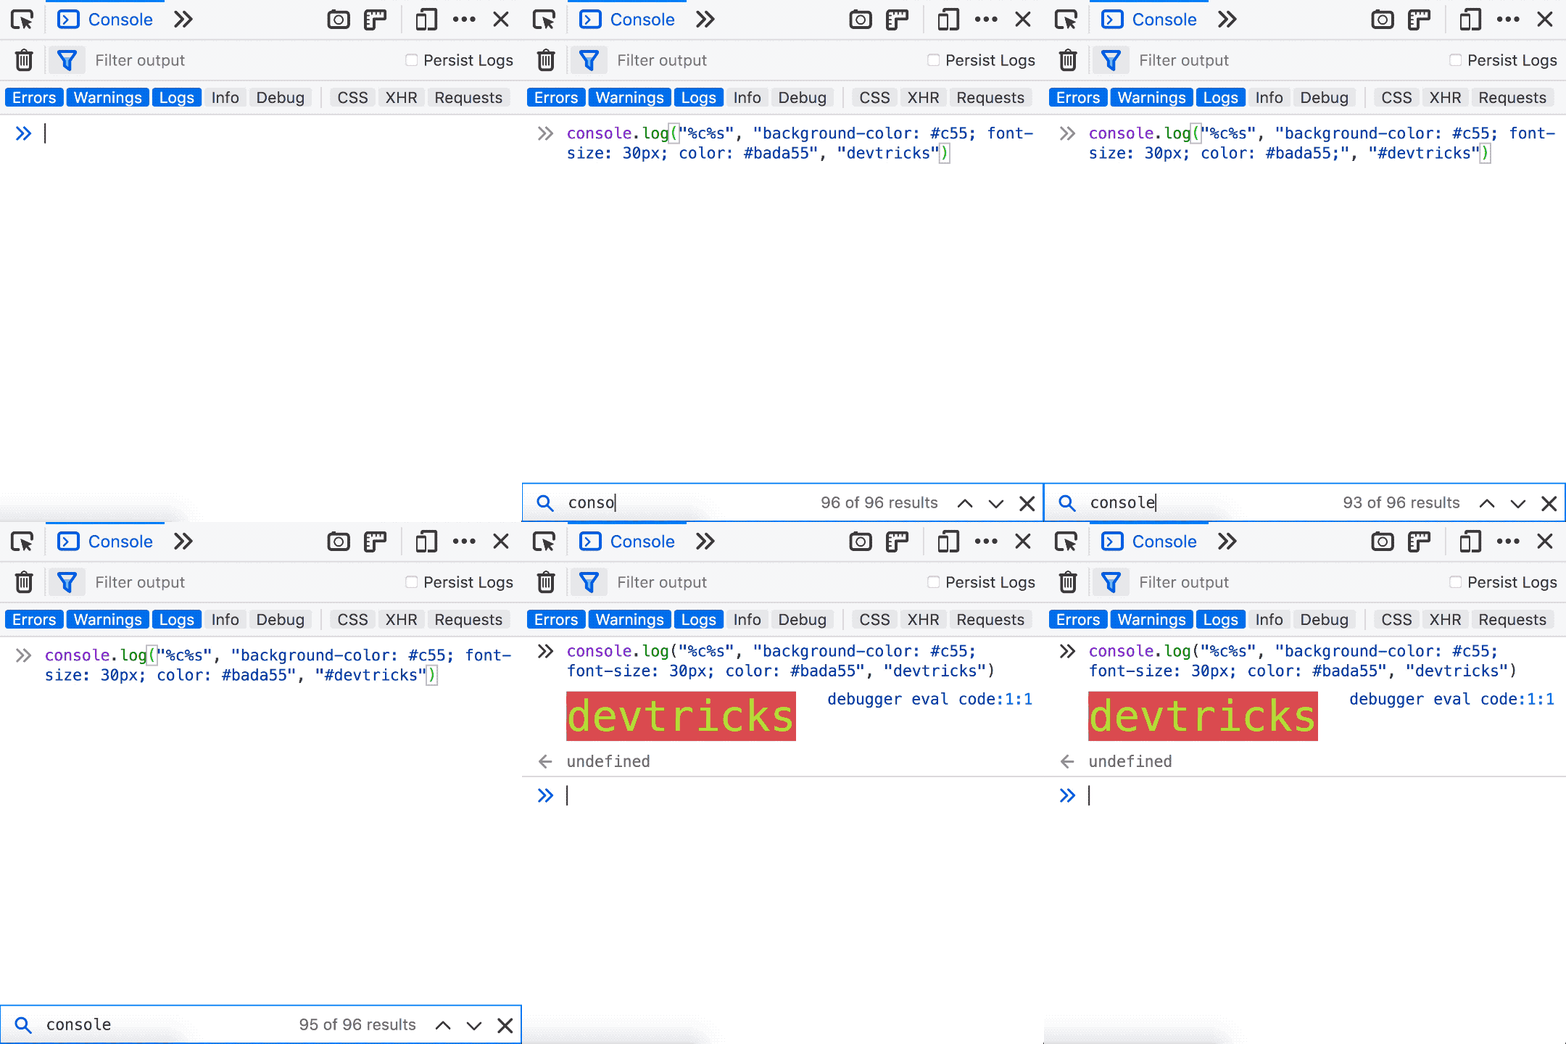
You can search through your Web Console history by pressing CTRL+R on a Mac (F9 on Windows and Linux). After that you can use CTRL+R / CTRL+S (F9 / SHIFT+F9) to move forward/backwards through the search results. It’s really handy to use instead of using the arrow keys, especially since the arrow keys only work for the current session.

Screenshots of a Page or Element on a Page
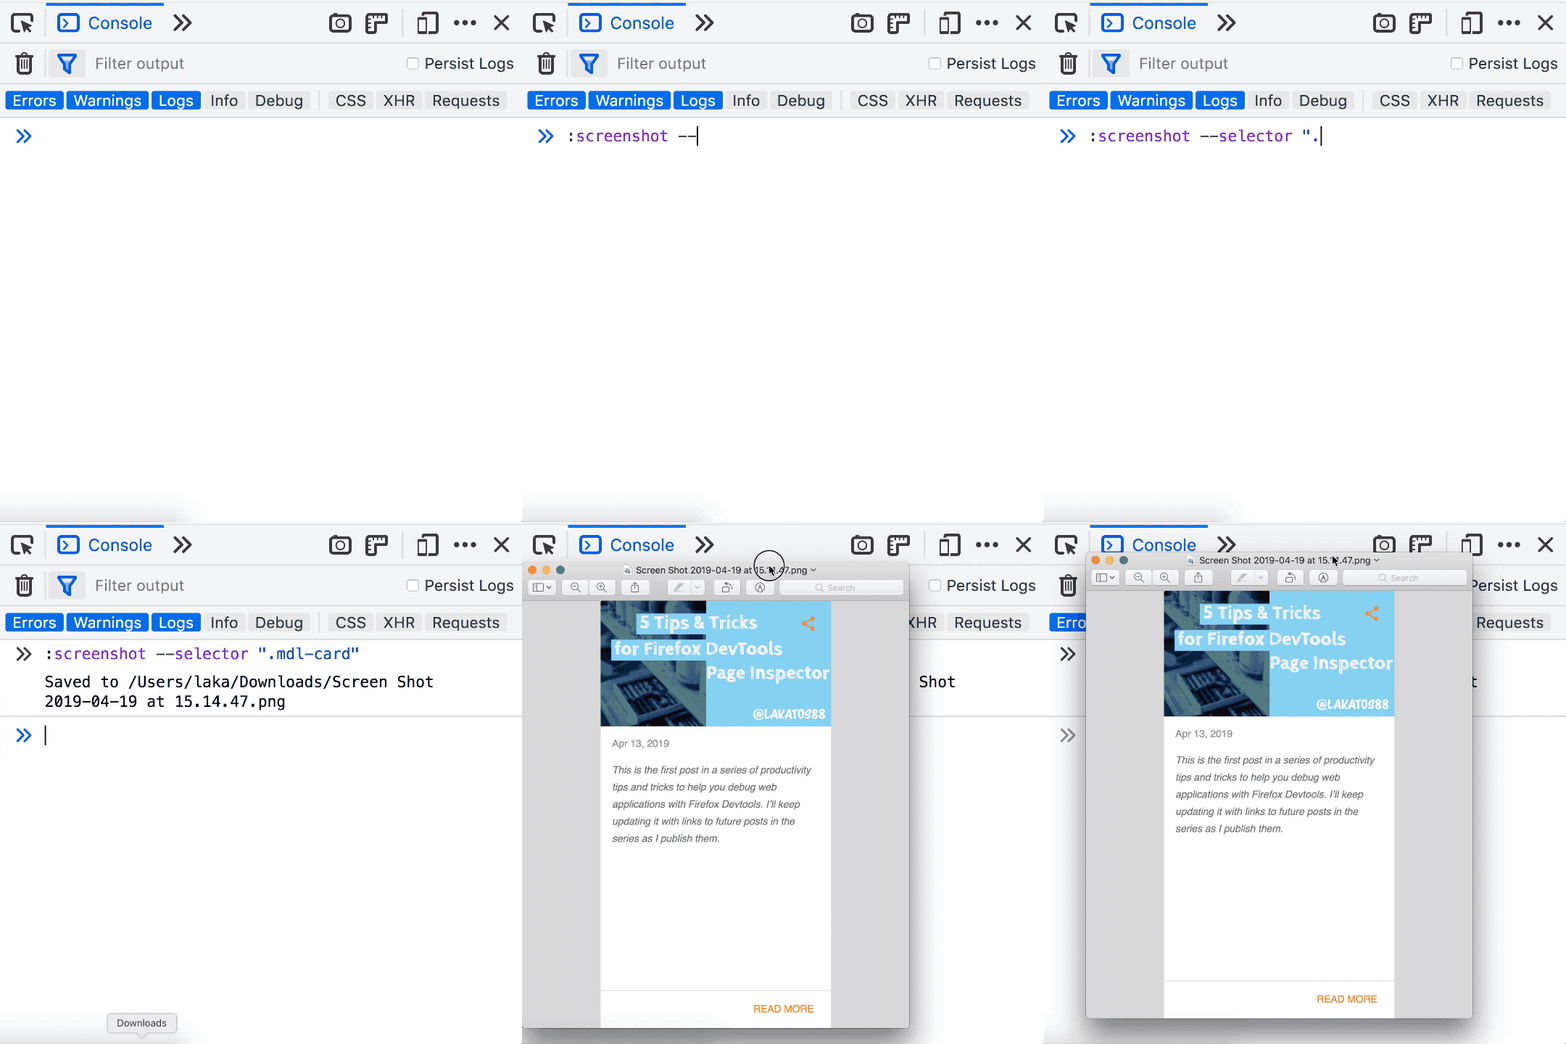
:screenshot --fullpage
:screenshot --selector .css-selector
You can take screenshots from the Web Console, of the visible section, the full page or an element on the page identified with CSS selectors. Really handy when you want to screenshot just an element exactly, whithout having to guess at the box model when you try to crop it out of the page screenshot.

Switch the Web Console JavaScript Context
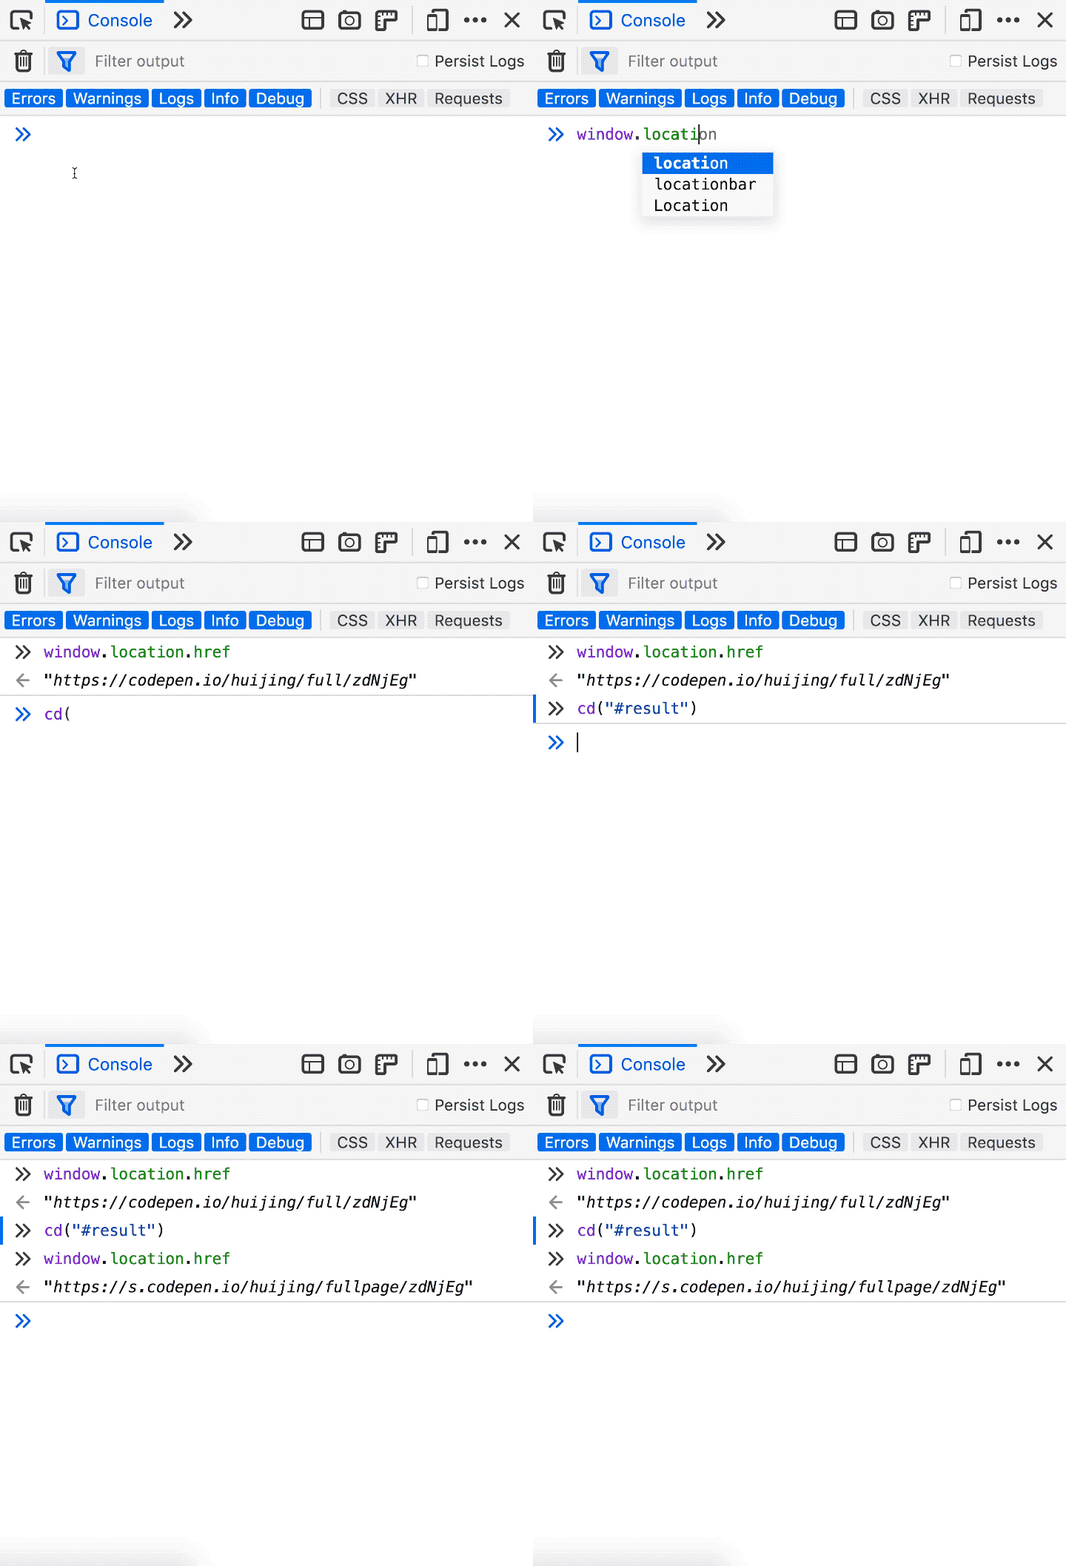
cd(iframe)
You can switch the Web Console’s JavaScript evaluation context to an iframe using cd(). You can use CSS selectors to target the iframe. It’s really useful to change the iframe in context, especially in places where you can’t open the iframe in it’s own window, like Codepen.

Labeled timer in the Console API
console.time("#devtricks")
console.timeEnd("#devtricks")
You can start a labeled timer from the Console API using console.time("label") and top it using console.timeEnd(label). It’s really handy when you want to log function execution times to the Web Console, keep track of them and label them accordingly.

It’s a weekly thing
This is a weekly thing, I’ve gathered so many tricks over the years. If you’ve liked this or want to see more, I’m @avolakatos on Twitter, follow me there, that’s where the magic happens.


