This is the first post in a series of productivity tips and tricks to help you debug web applications with Firefox Devtools. It shows you 5 tips & tricks for working with the Page Inspector in the Firefox Developer Tools.
CSS Selector Search in the Page Inspector
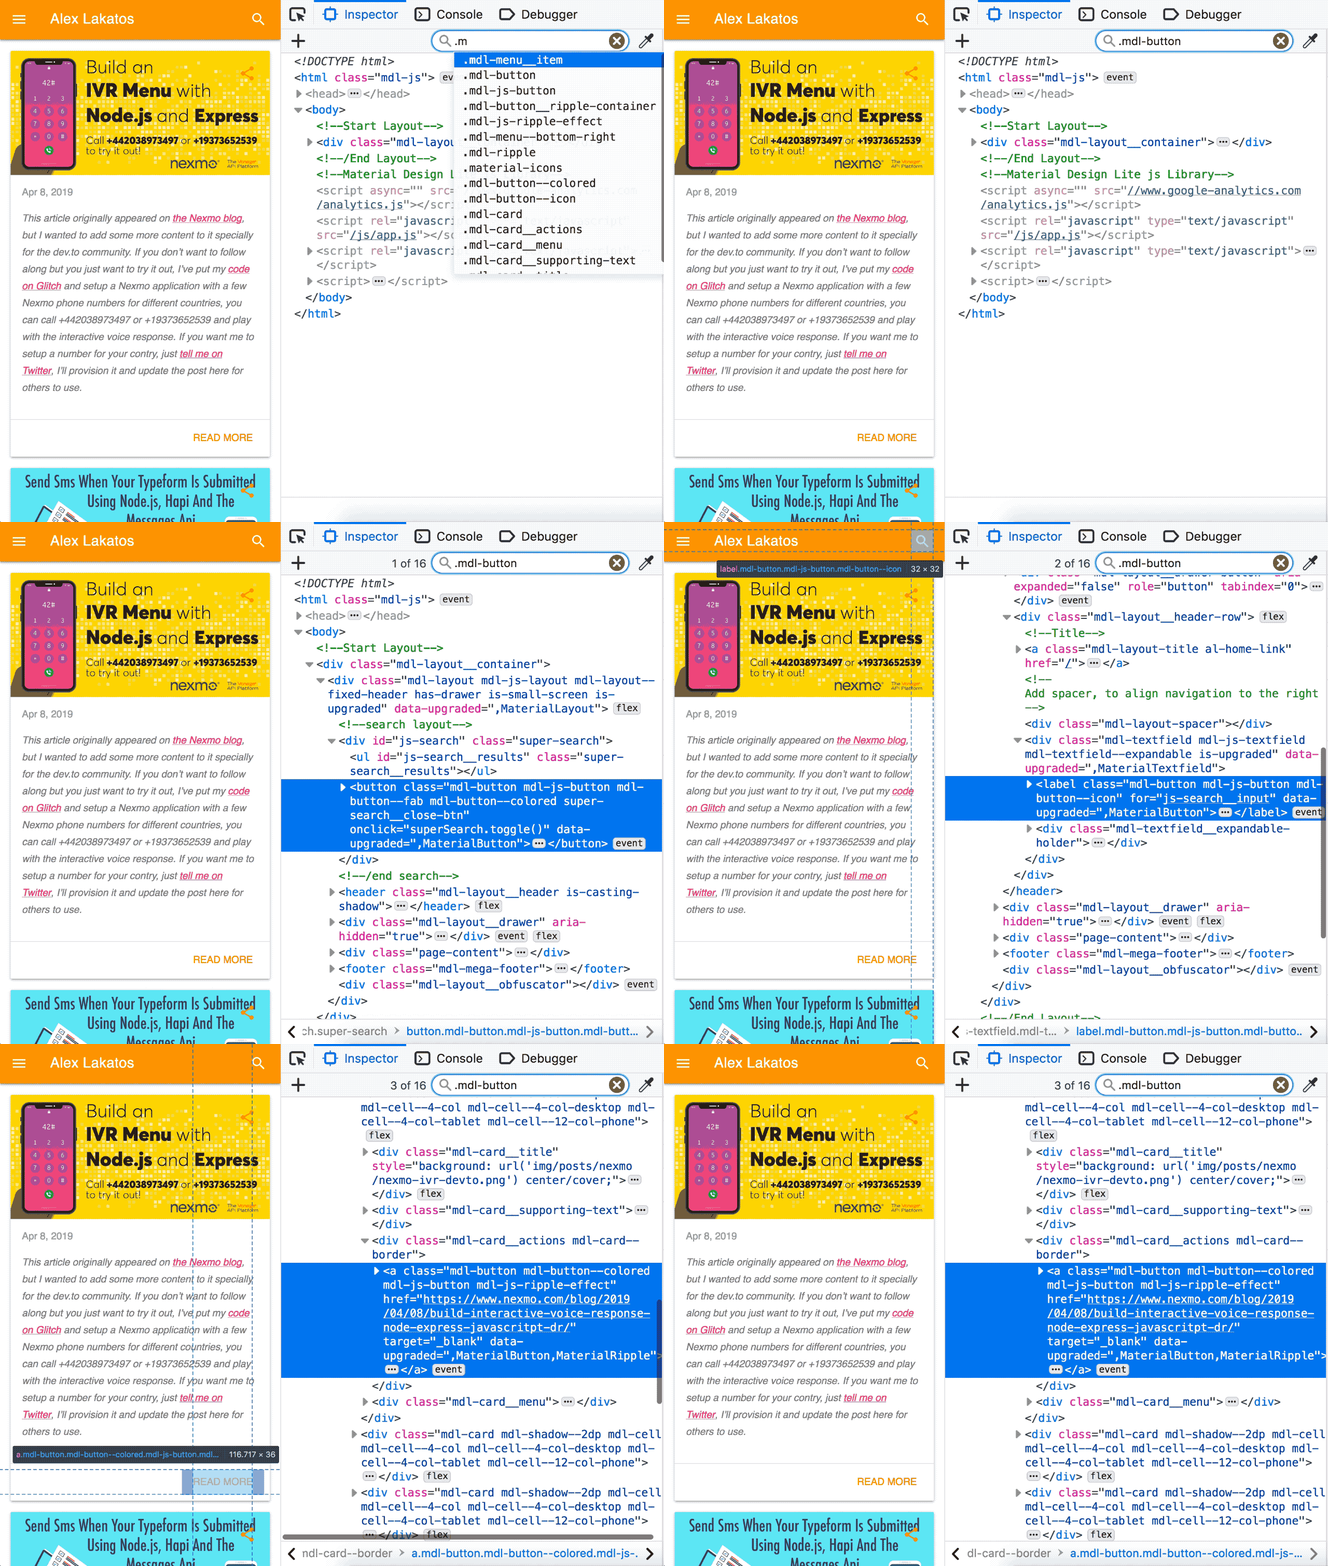
You can use CSS Selectors in the Firefox Developer Tools Page Inspector search box. It’s really handy for:
- elements with a
z-indexthat you can’t directly right-click onto - looking for generic text elements that you know the selector of
- finding elements that are visually the same but have a specific class/selector
Filter Styles in the Rules view
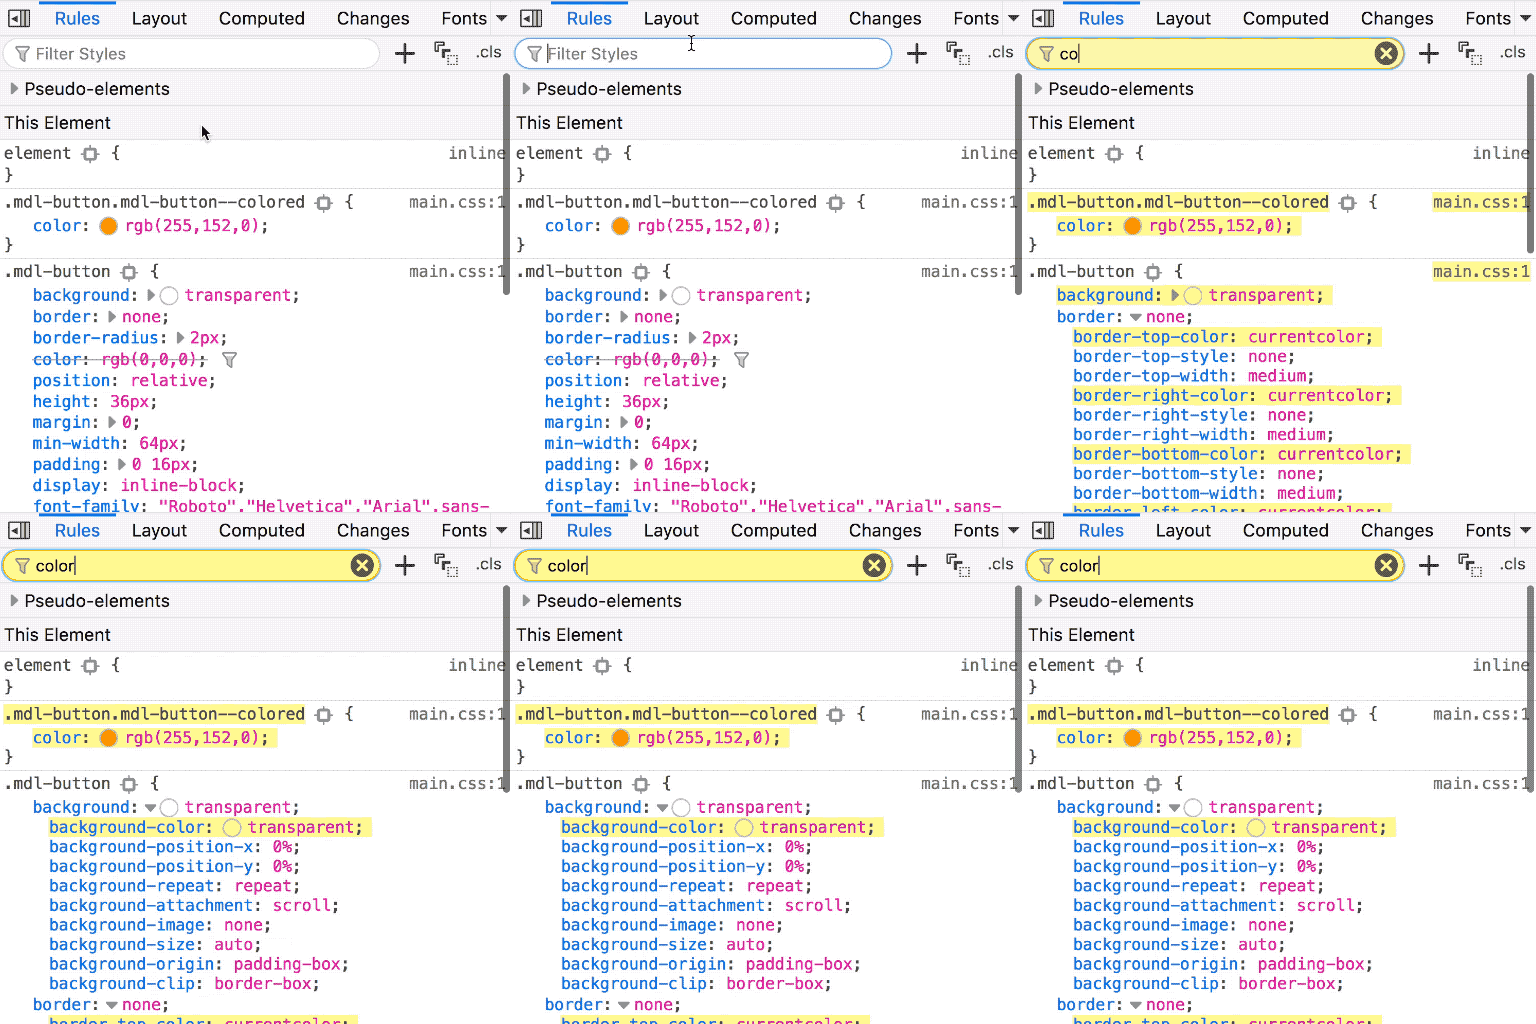
You can filter the CSS rules in the Styles view of the Inspector by any selector or property. For selectors, it hights the selectors in the rules list, and for the properties it expands all the properties containing your filter inside (e.g. the border shorthand has border-color in it), it highlights the properties containing your filter and it hides the rules that don’t. It’s really handy when you’re using competing selectors in a framework, focuses just the things that are related. Or when you have composed properties like border or background, because it expands them into the composing properties that have the filtered property in it.
Color Picker & Eyedropper tool in the Rules view
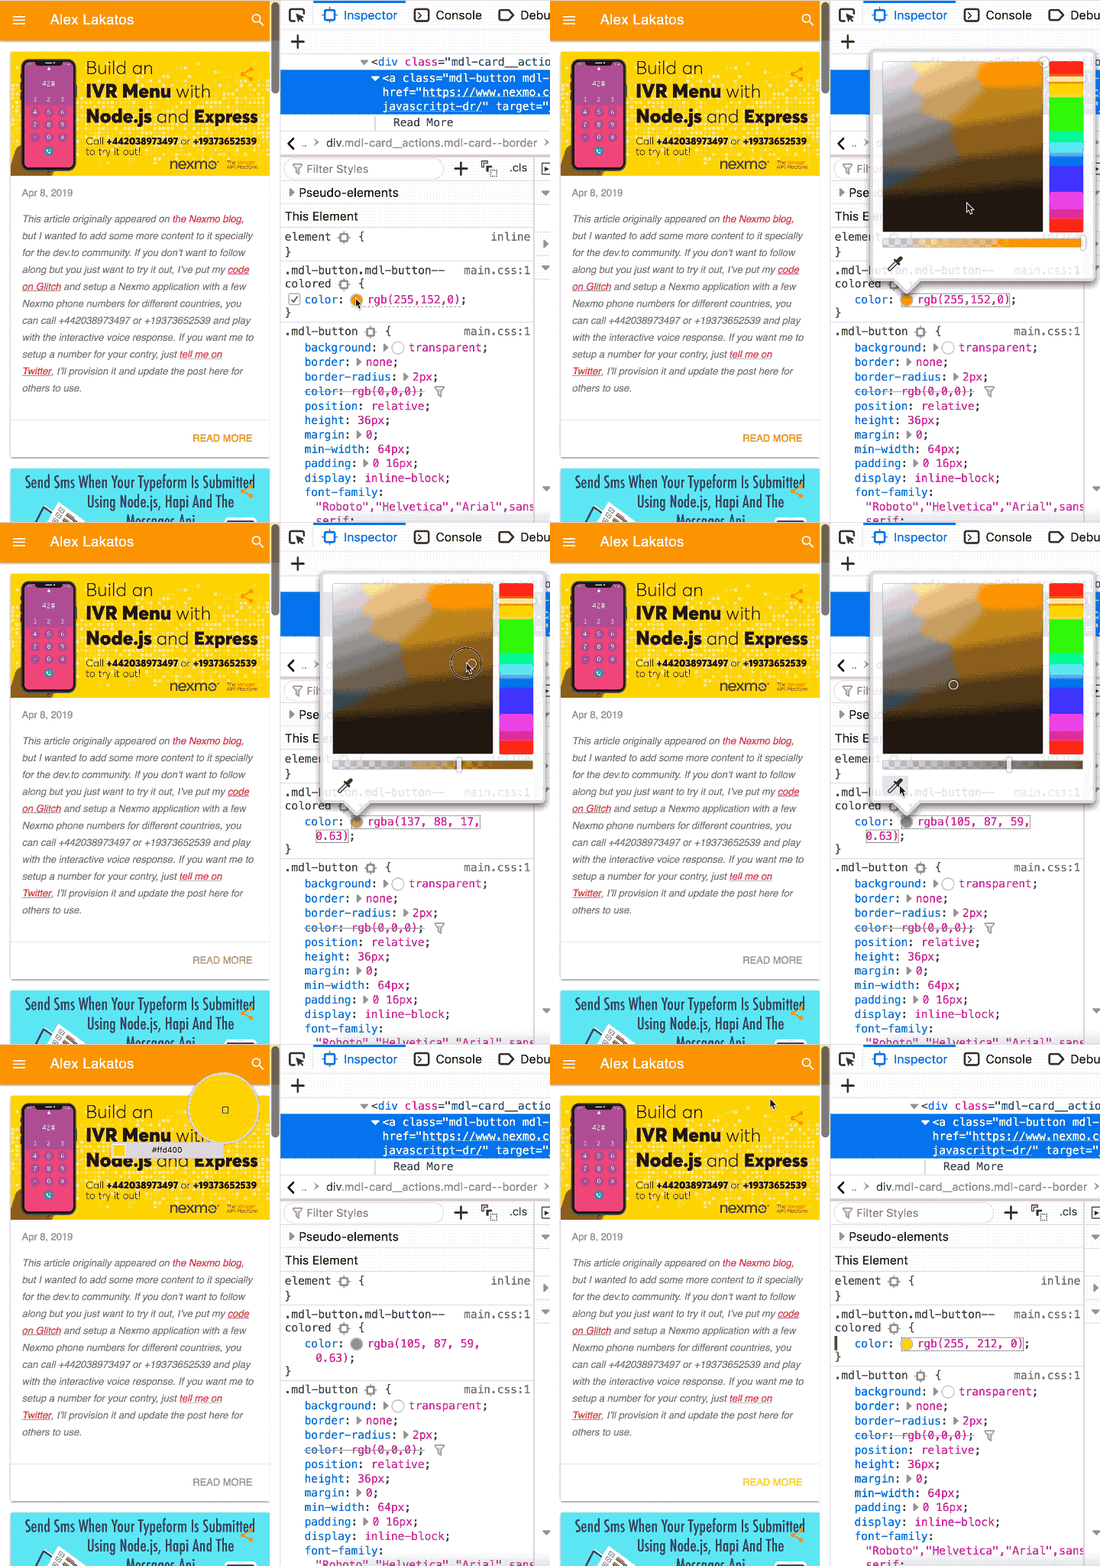
Click on the colored dot next to any color property and it opens a color picker with a handy eyedropper tool. The eyedropper has magnification when you hover the page, so it’s easier to pick the color from a specific pixel. Really handy if you’re a visual person and want to fiddle with the color in place or if you want to use colors from a different part of the page without changing between the rules to get the color.
Color Representation in the Rules view
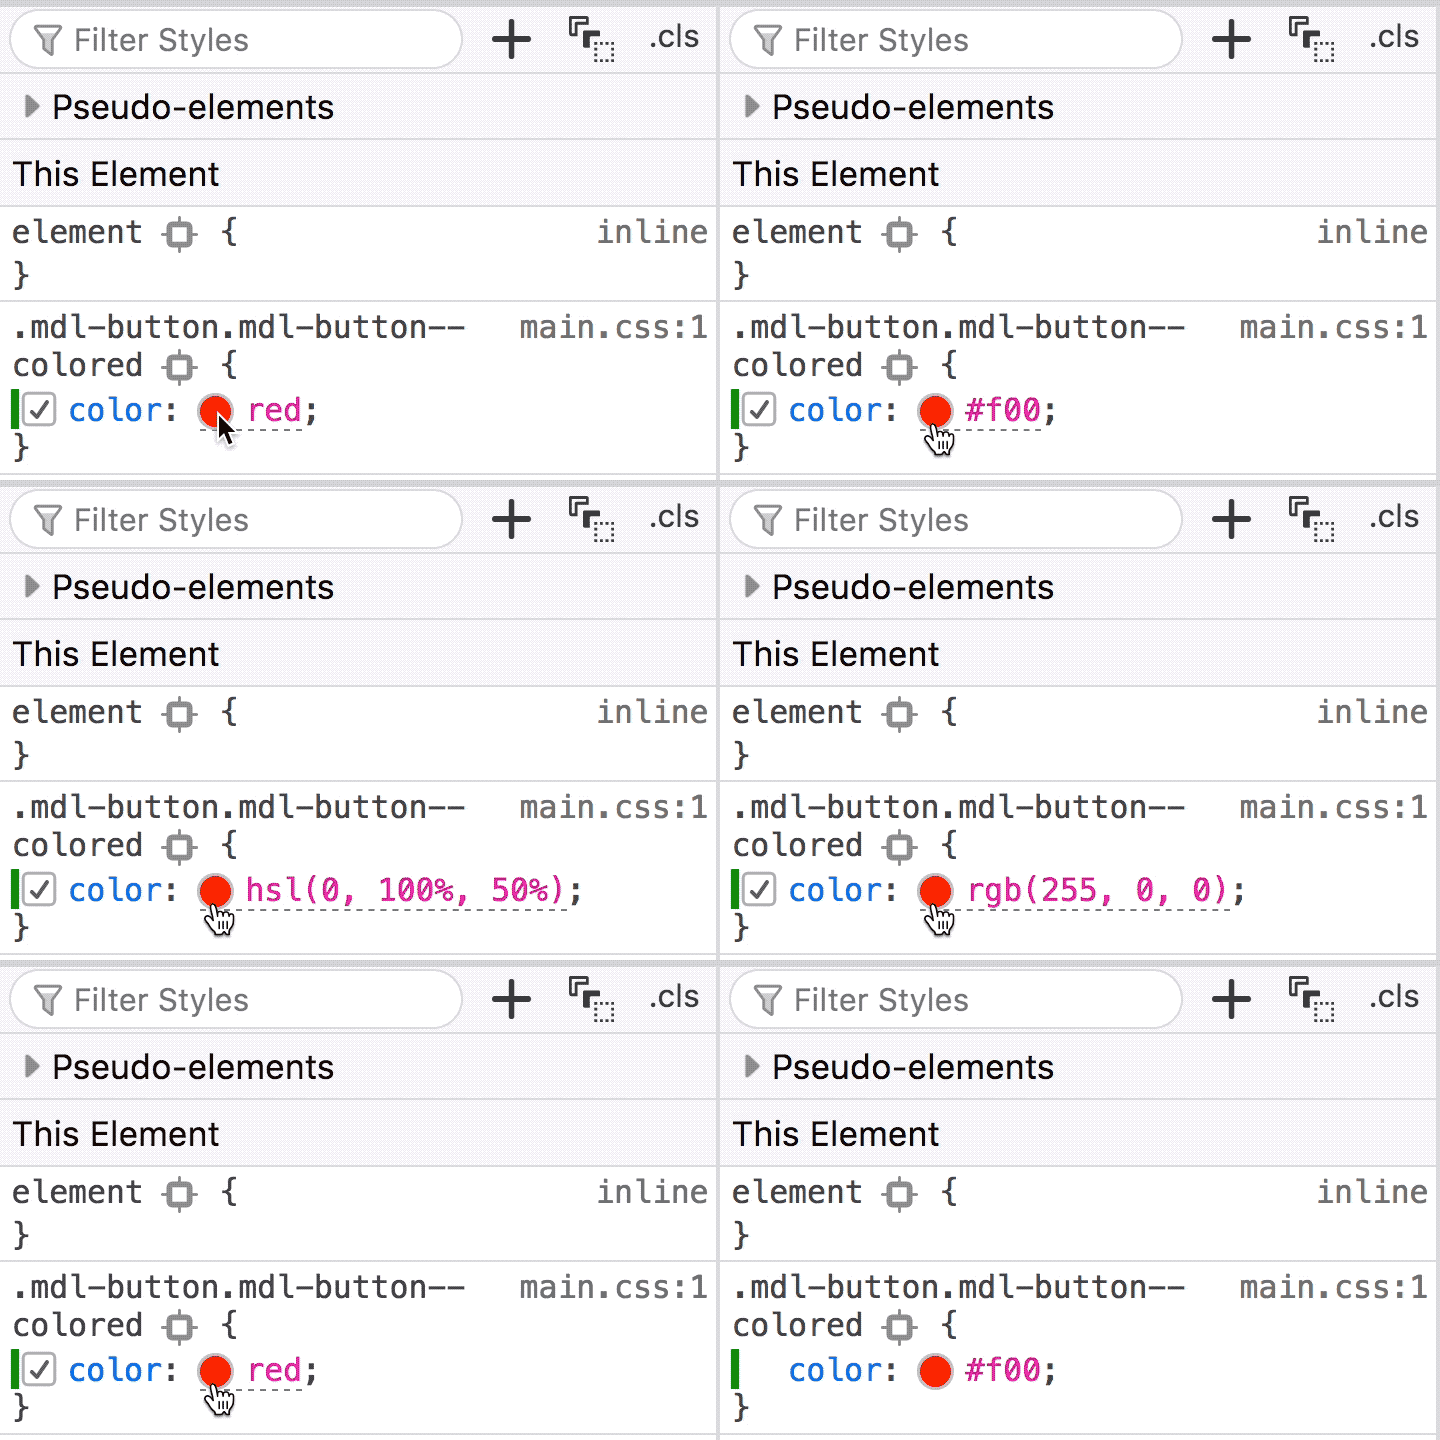
SHIFT + Click on any colored dot next to a color property and it changes between the 3 or 4 (not all colors have a name, so you’d have only 3 representations for those colors) color representations available for the color: name, hex, hsl and rgb. It works the same for angles, if you SHIFT + click the dot next to a rotate degree unit, it shifts representations between deg, rad, grad and turn. Really handy when your style guide asks for HEX colors but you’re more familiar with hsl or rgba.
Timing Function Bezier Editor in the Rules view
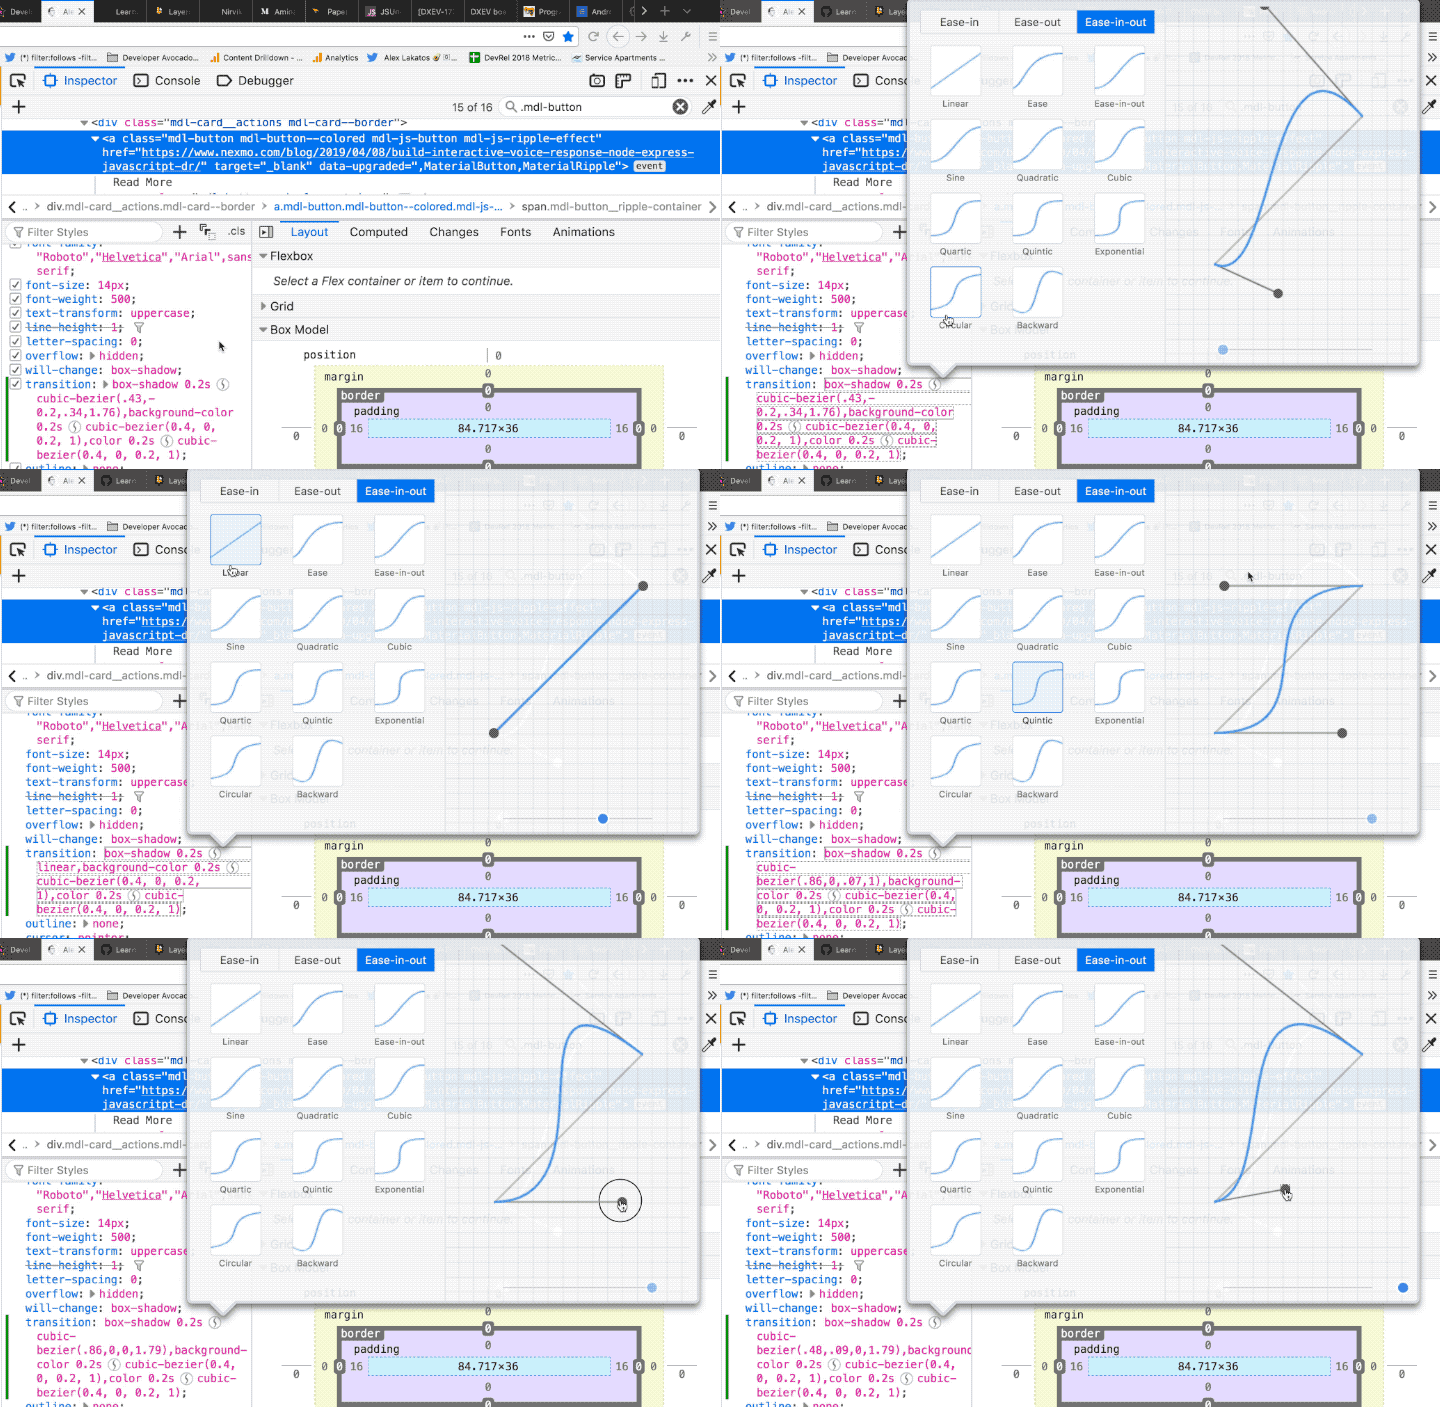
You can click on the curved line dot next to any property with a timing function (e.g transition, animation), and it opens up a set of pre-defined transitions plus a bezier curve editor. Really handy to test out transitions, there is an animated slider that shows you the timing, and especially handy if you want a custom functions, it calculates the cubic bezier curve for you.
It’s a weekly thing
If you wonder why this came to be, the reasons are simple enough:
- I’ve been using the Firefox DevTools every single day since they were being developed. Initially as the QA Owner for a bunch of them and after that in my day to day work as a JavaScript Developer on the open web.
- The Chrome DevTools get a lot more love on the internet, but Firefox DevTools have an amazing engineering team behind them with a lot of useful features. Some are on par with Chrome, some are better and some aren’t even in Chrome yet. Of course some are better in Chrome (I’m looking at you, Debugger), and I’ll be sure to point out the differences for the tricks I’m showing when there is a difference between the two.
I’m trying to make this into a weekly thing, I’ve gathered so many tricks over the years. If you’ve liked this or want to see more, I’m @avolakatos on Twitter, follow me there, that’s where the magic happens.


