This is the third post in a series of productivity tips and tricks to help you debug web applications with Firefox Devtools. It shows you 5 tips & tricks for working with the JavaScript Debugger in the Firefox Developer Tools.
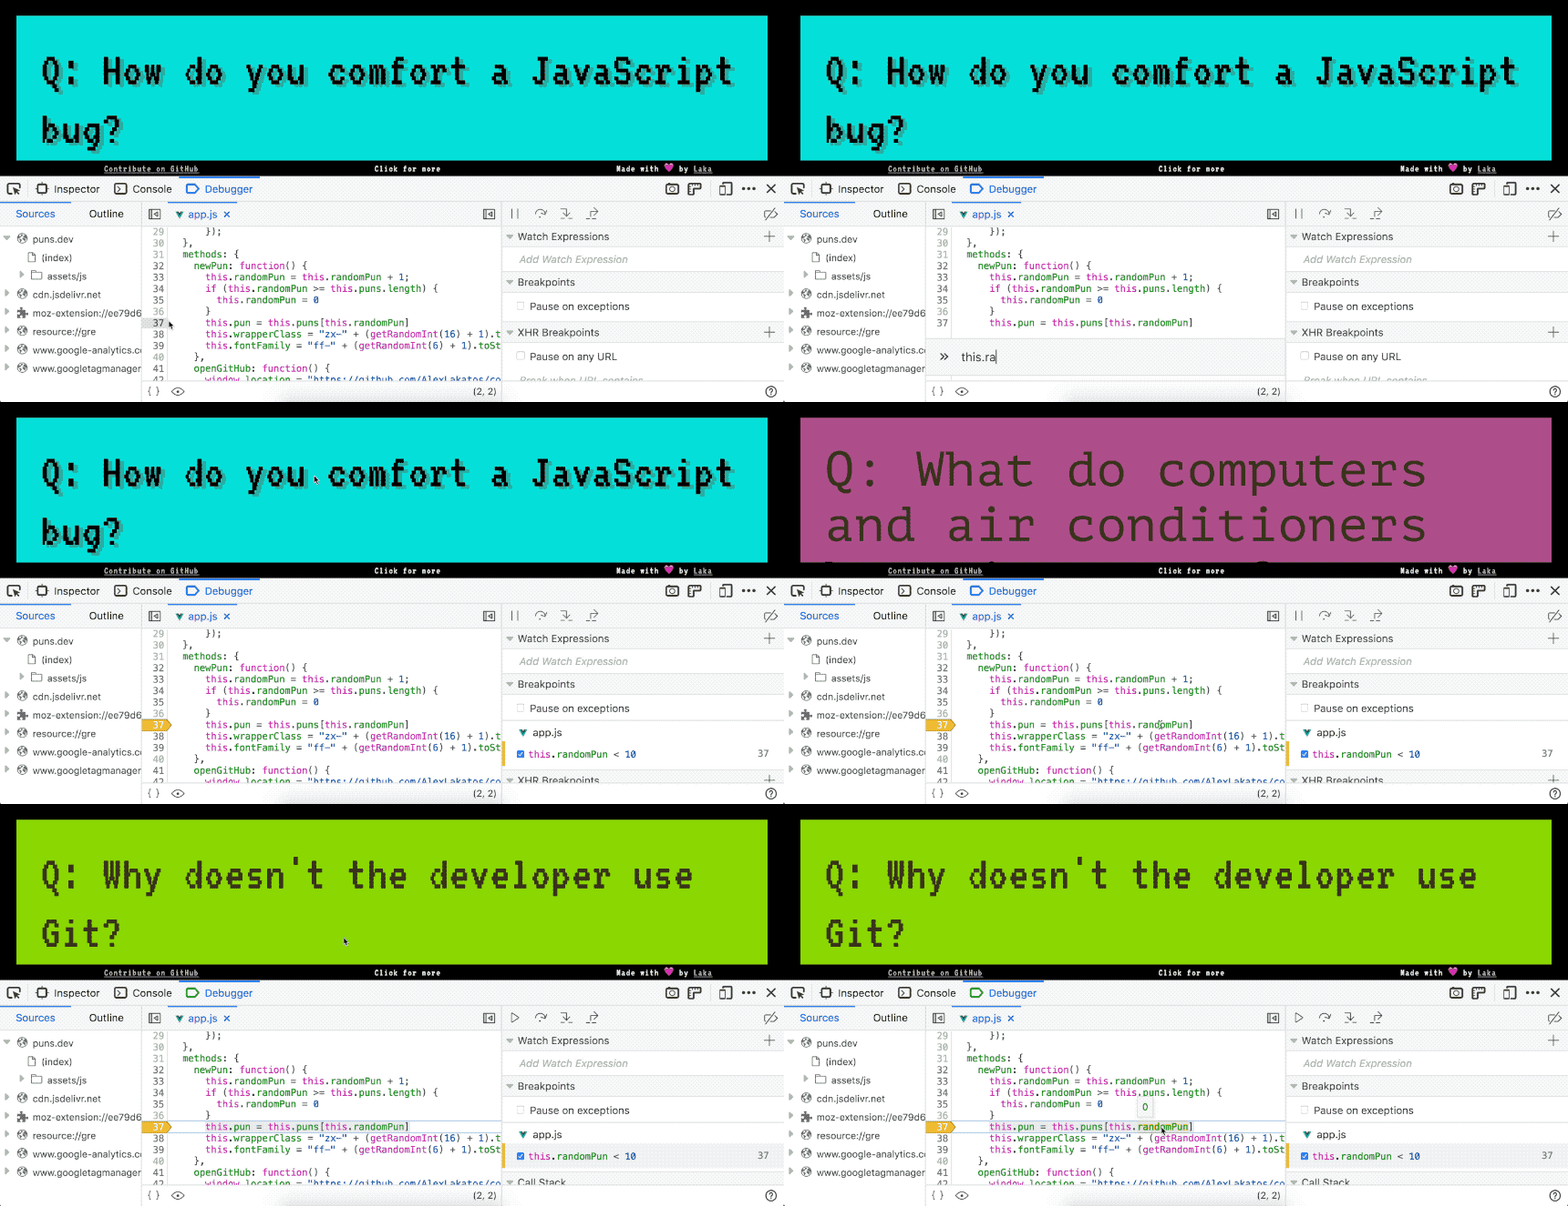
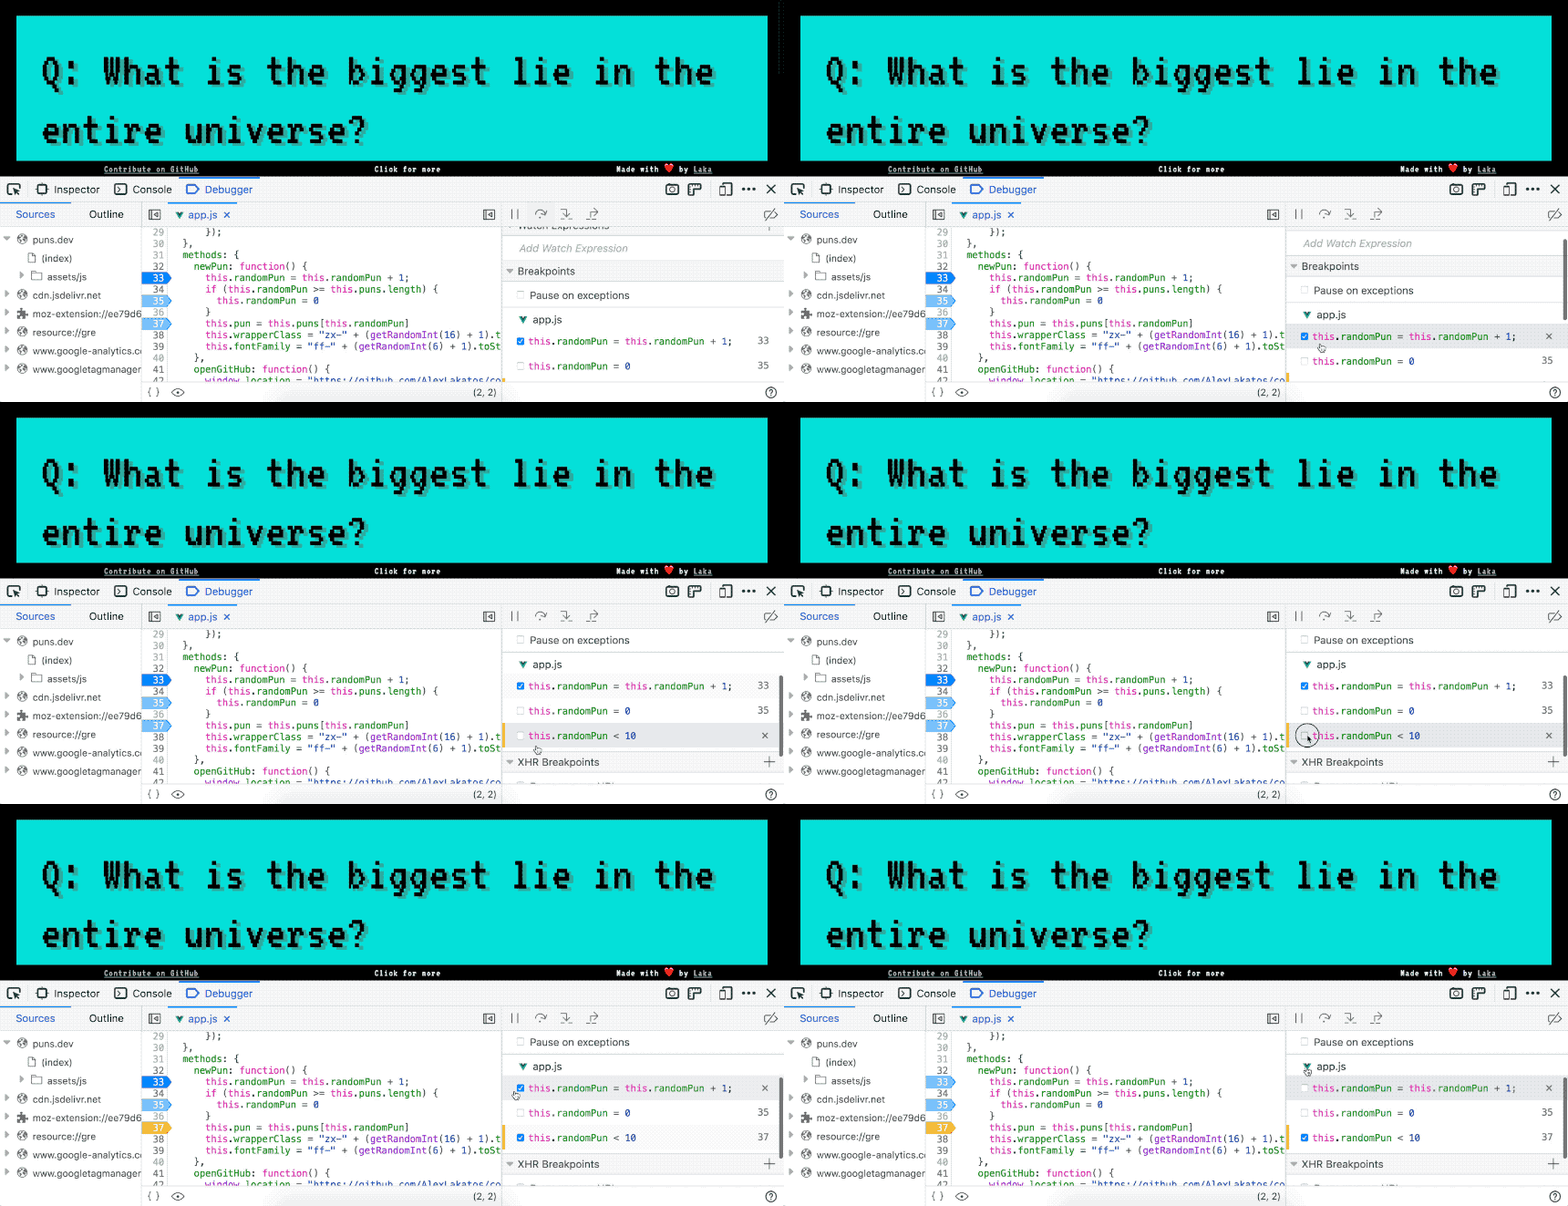
Set Conditional Breakpoints
You can set conditional breakpoints in the Firefox Developer Tools JavaScript Debugger by right-clicking the line number. The breakpoint will become active and pause the execution only if the condition is met. It’s really handy for debugging intermittent bugs and pausing execution on specific values and ranges.
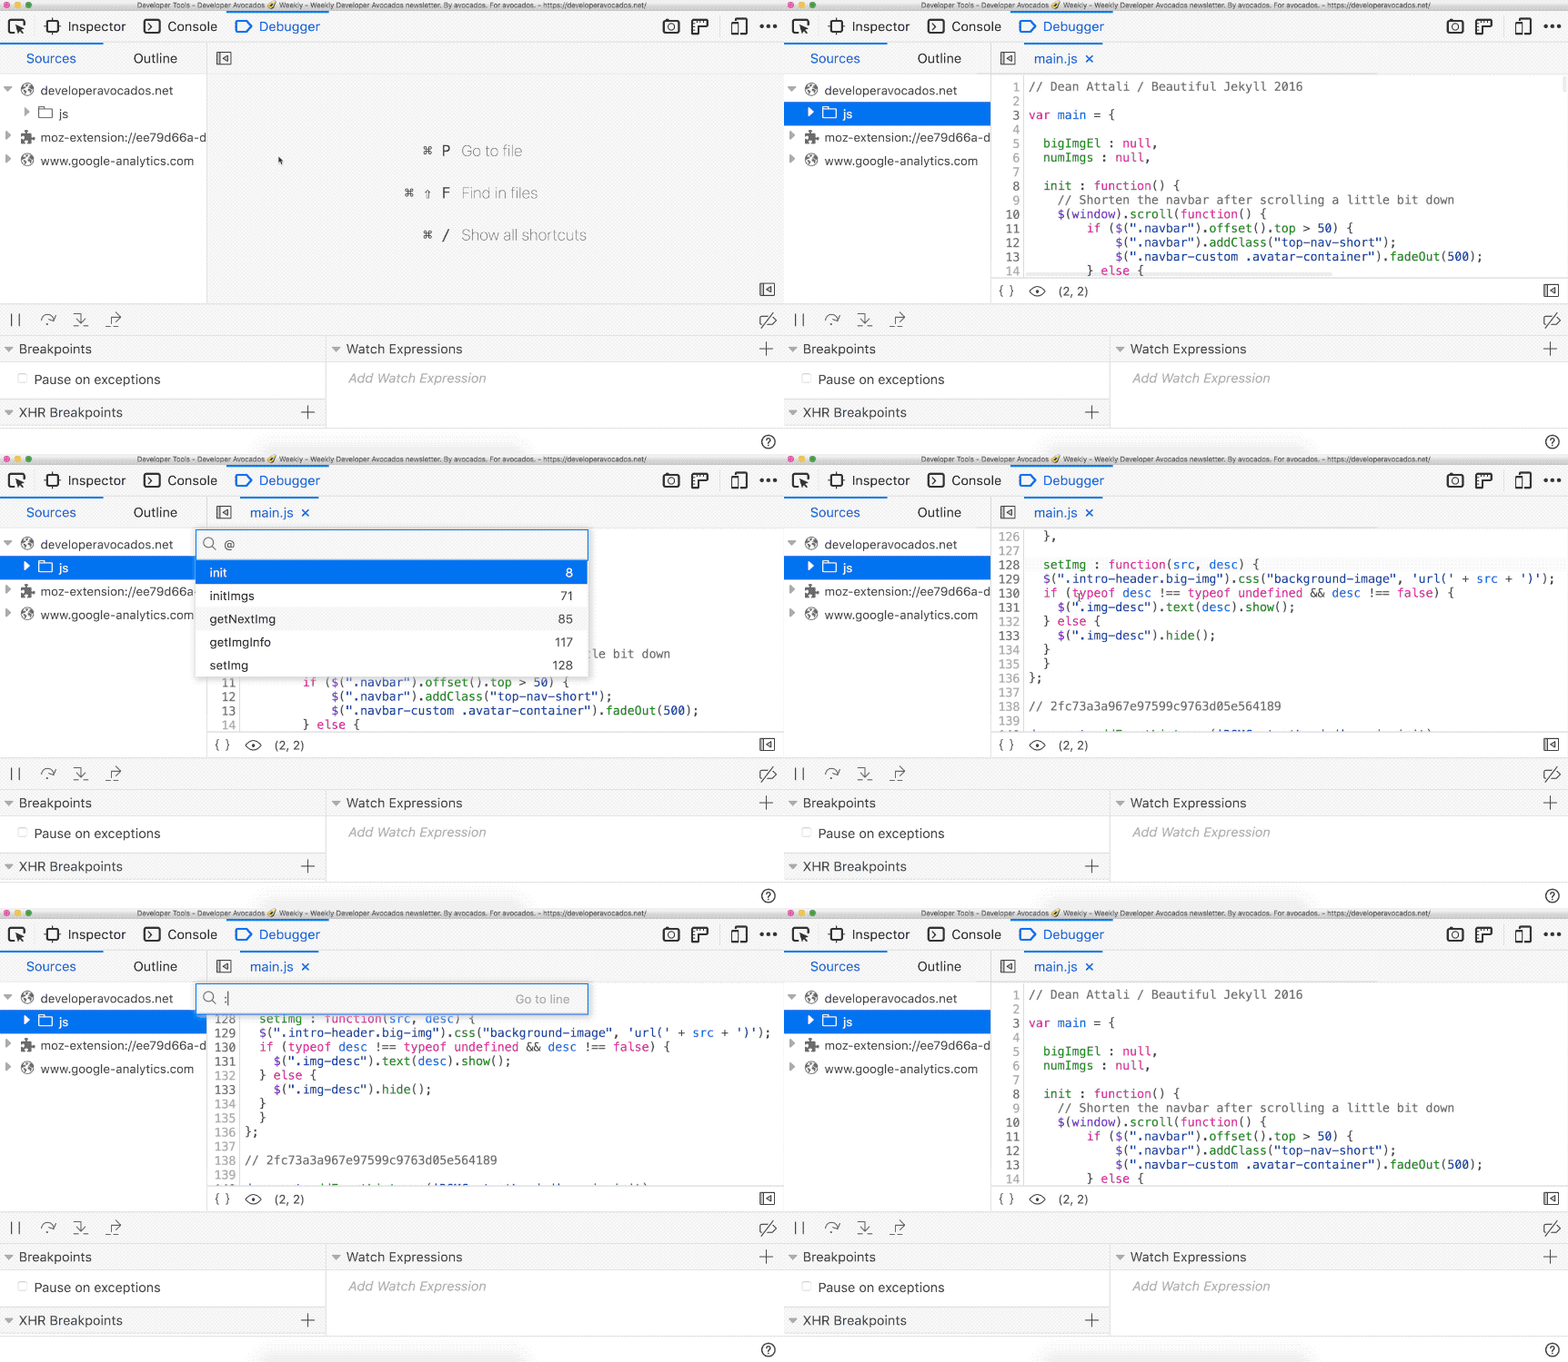
Search by Function Name or Line Number
You can search for a file name through the JavaScript Debugger by pressing CMD + P on a Mac (CTRL + P on Windows and Linux). If you want to search for a function inside that file or go to a line number directly, there are other shortcuts, but I always forget them. Instead, you can type @ in the same search box, and that looks for a function definition. If you start your search with :, that will go to a specific line.
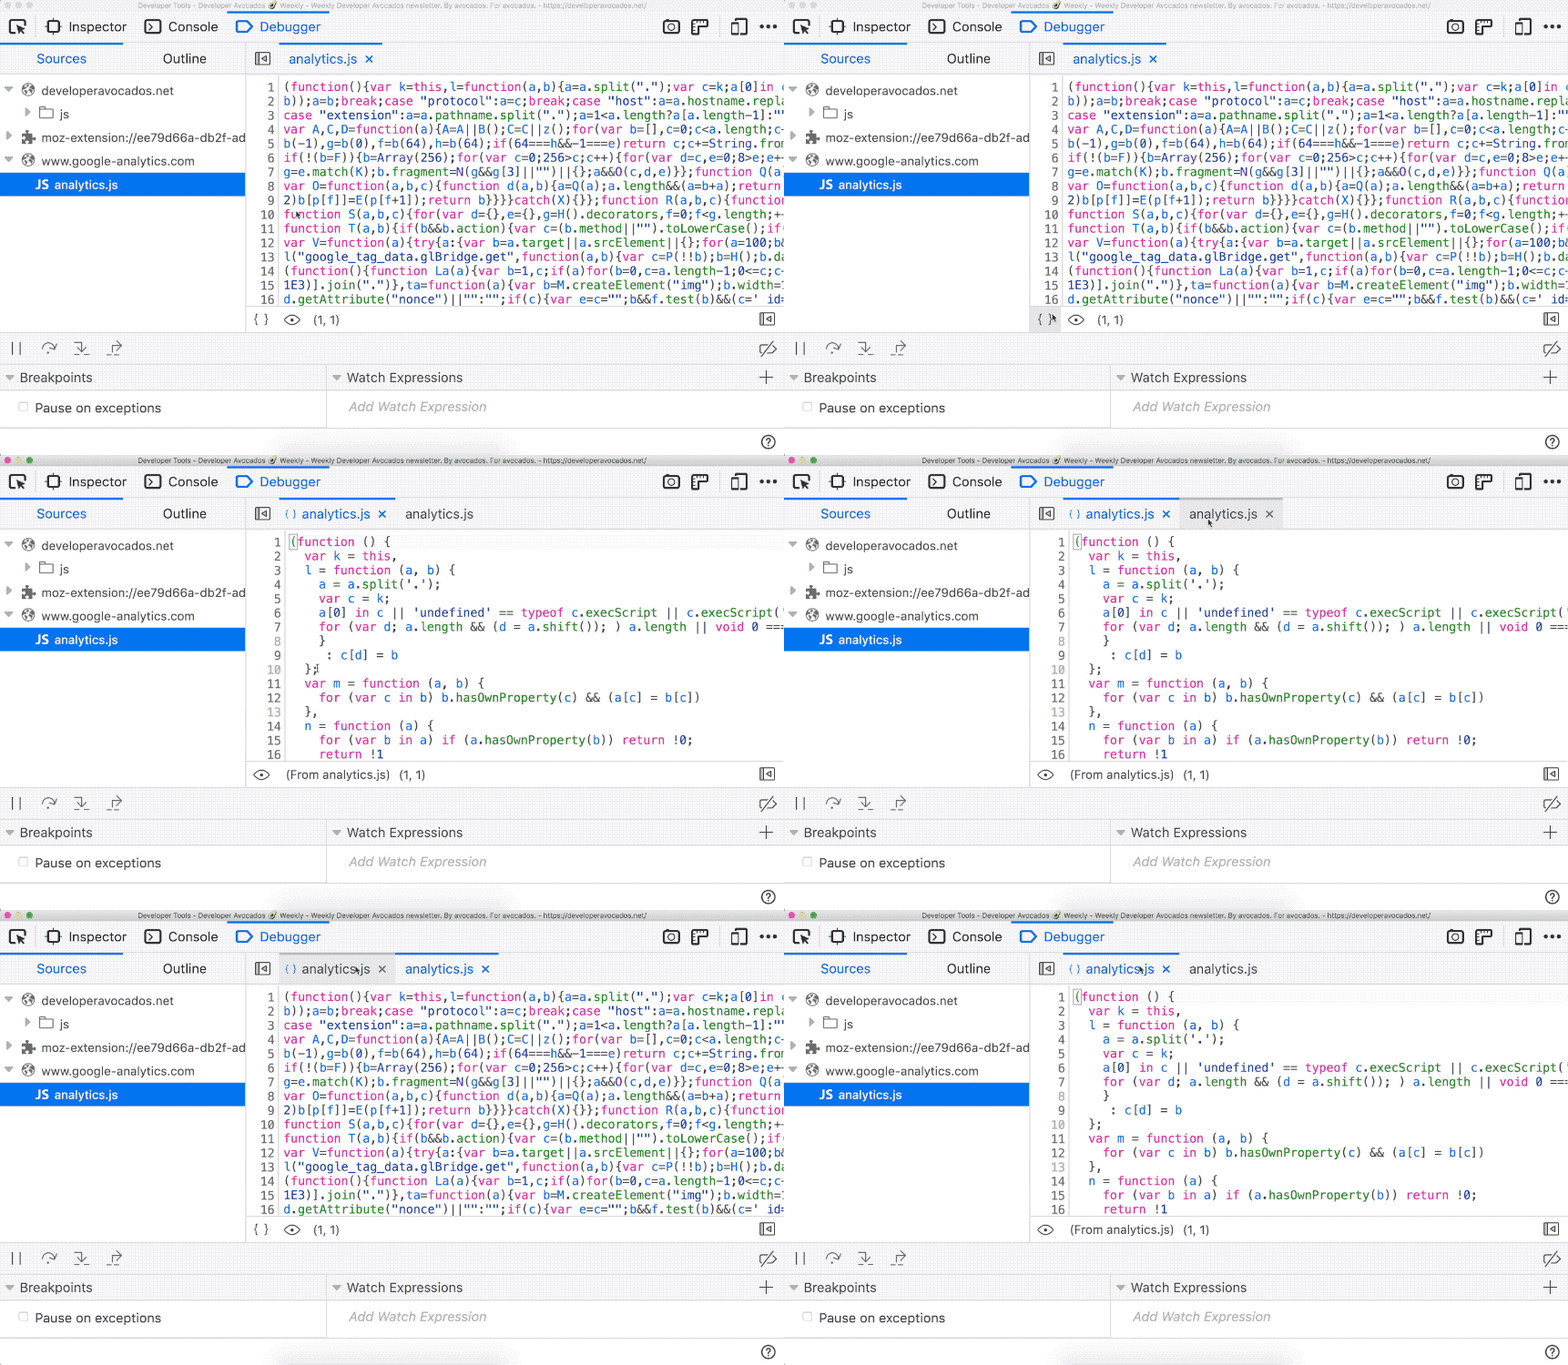
Pretty Print Minified Code
You can pretty print minified code in the JavaScript Debugger by pressing the {} icon. I use it mostly when trying to do a little debugging in production or other people’s websites, and there are no source maps available.
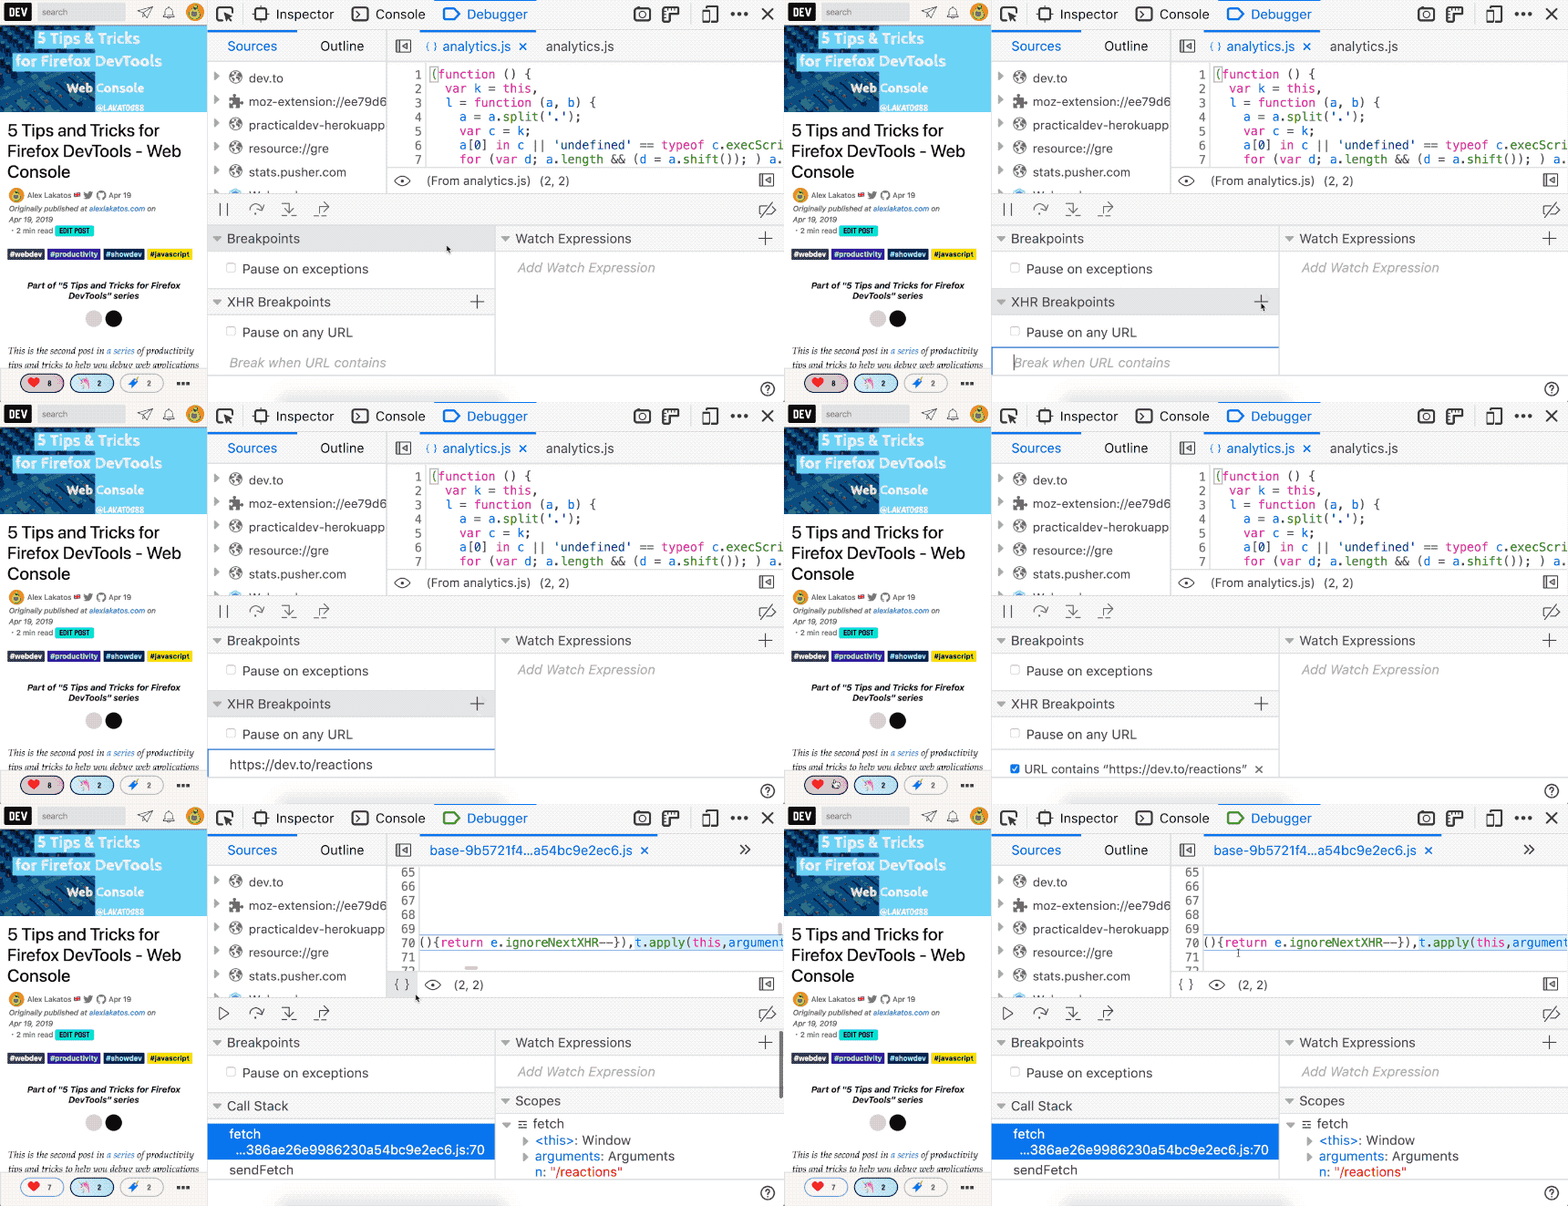
Set URL Breakpoints
You can set URL breakpoints in the Firefox Developer Tools JavaScript Debugger. The breakpoint will become active and pause the execution when the page tries to access an URL matching the rule you’ve set. It’s really handy for evaluating the state of your application when network requests happen, as well as pinpointing the exact line of code that triggered a network request.
Disable Breakpoints
You can disable and re-enable breakpoints in the Firefox Developer Tools JavaScript Debugger. They will remain set, but become inactive and will not pause execution of your code. It’s really handy when debugging if/else clauses because you don’t have to remember where you’ve put your debugging points the last time.
It’s a weekly thing
This is a weekly thing, I’ve gathered so many tricks over the years. If you’ve liked this or want to see more, I’m @avolakatos on Twitter, follow me there, that’s where the magic happens.


